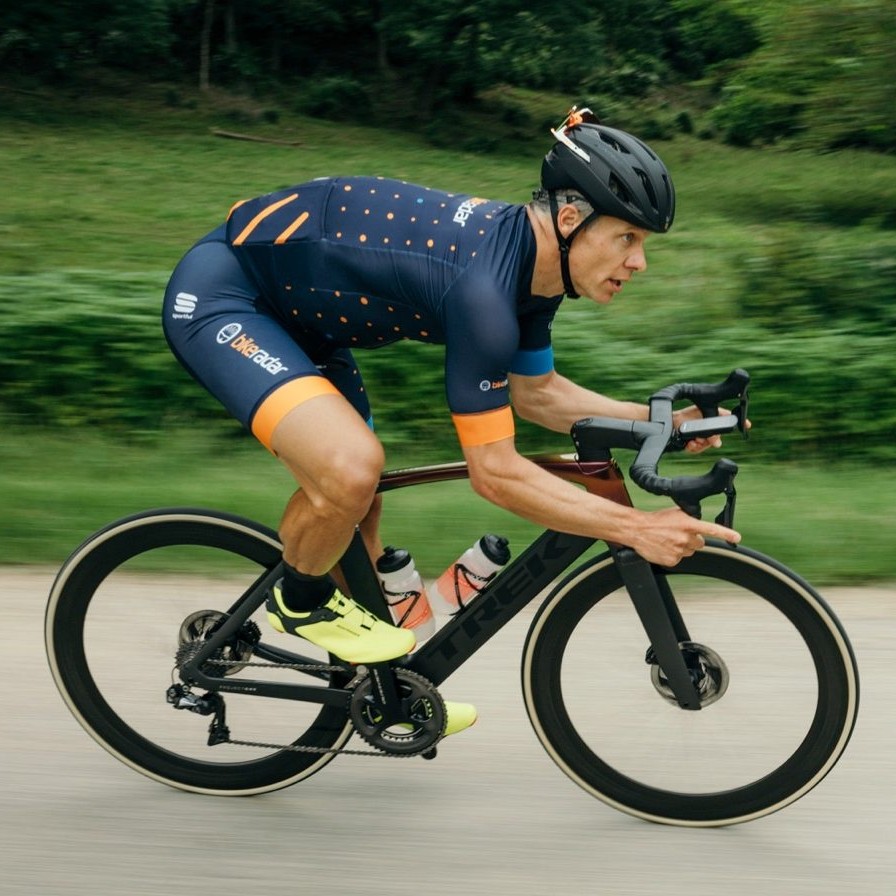
Can different drink mixes cause your threshold power to vary by more than 10 percent and affect your internal body temperature differently? Not likely, right? That is exactly what I thought — until I participated in a test of two riding trials in identical conditions using two different types of drinks: the relatively new Osmo Active Hydration and a high-carbohydrate drink mix.
The test was conducted by Dr. Stacy Sims, Osmo Nutrition's chief research officer, and only 18 of us participated in this particular round. So — excuse the hydration pun — take the arguments with a grain of salt. But the protocol was straightforward and the results were surprising.
Dr. Sims came to visit BikeRadar in Boulder, Colorado, to demonstrate not only her product but her hypothesis, as she called it, that drinks with low osmolality, or low solute concentration, are more rapidly absorbed by the body and therefore keep a cyclist cooler and more efficient than drinks with a high osmolality. Her philosophy is that hydration and fuel should be separate things, not a combined high-calorie drink.
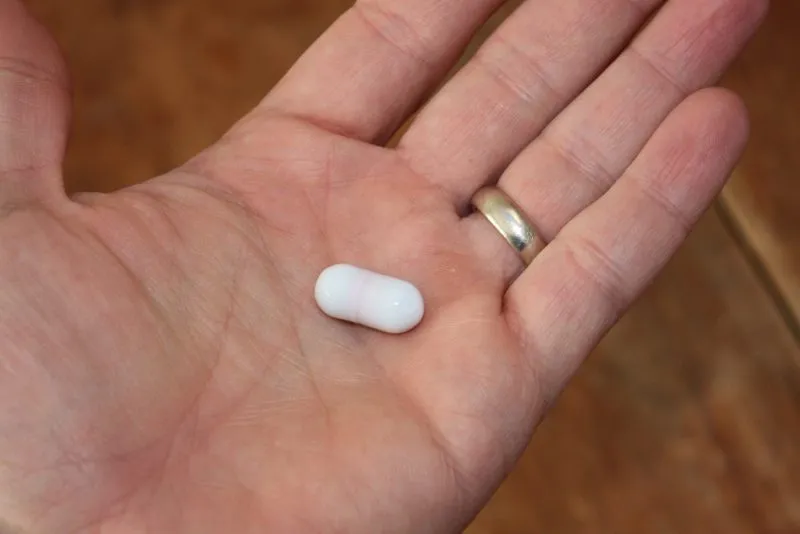
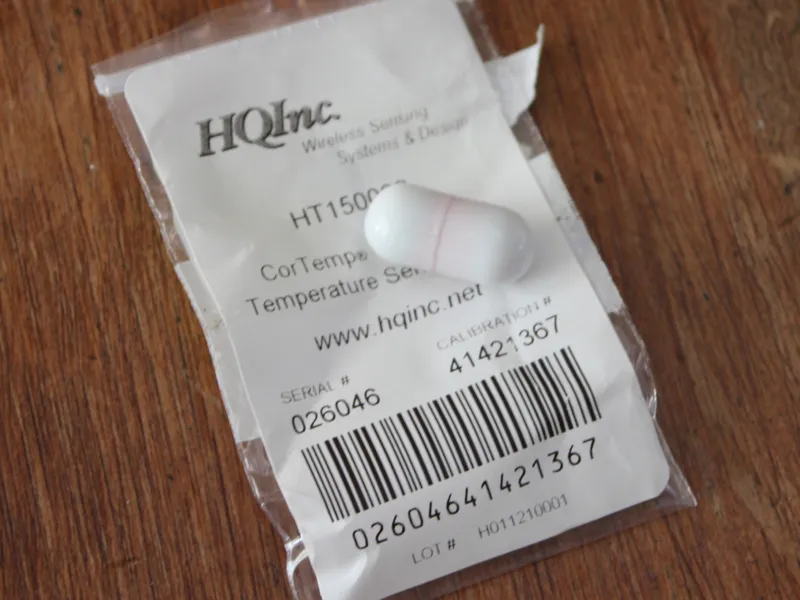
We swallowed one of these thermometers 12 hours before each test
Dr. Sims, an exercise physiologist and nutrition scientist, worked at Stanford University and for pro teams like Garmin-Slipstream and Leopard-Trek. She collaborated with Dr. Allen Lim on a few projects, one of which culminated in Skratch Labs. The two went their own ways, however, and Osmo was launched last May.
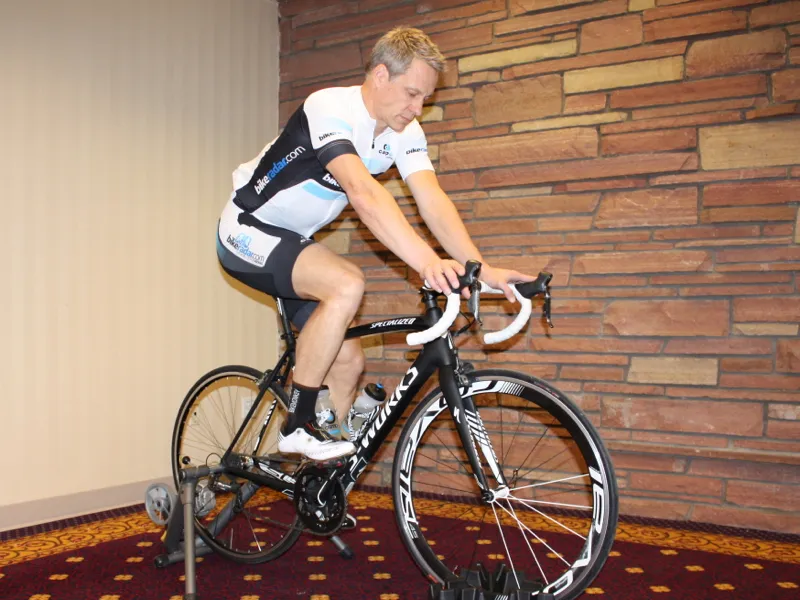
To test her hypothesis, Dr. Sims had us perform the following protocol on turbo trainers for each of the drinks, separated by 48 hours.
- 10-minute warm-up
- 60 minutes at 70% of threshold power (190 watts for the BikeRadar test)
- 15-minute time trial — without being able to see power numbers
- cool down
She asked us to normalize as many external factors as possible — sleep, food and caffeine intake, 60-minute easy ride the day before, etc. — and she created a test setting in a hotel with a normalized room temperature and large fan.
Some testers had 2.5 bottles of Osmo to drink and 6 Clif Bar Bloks during the first test. Other testers had the same volume of another drink mix with a much higher carbohydrate solution and a gel. Then each tester switched for the second test. Combined, each test intake amounted to roughly 400 calories.
During the warm-up and the 60-minute steady-state ride we could look at the power numbers on our computer. For the 15-minute time trial, however, she removed the head unit, leaving us with only perceived exertion to gauge our efforts.
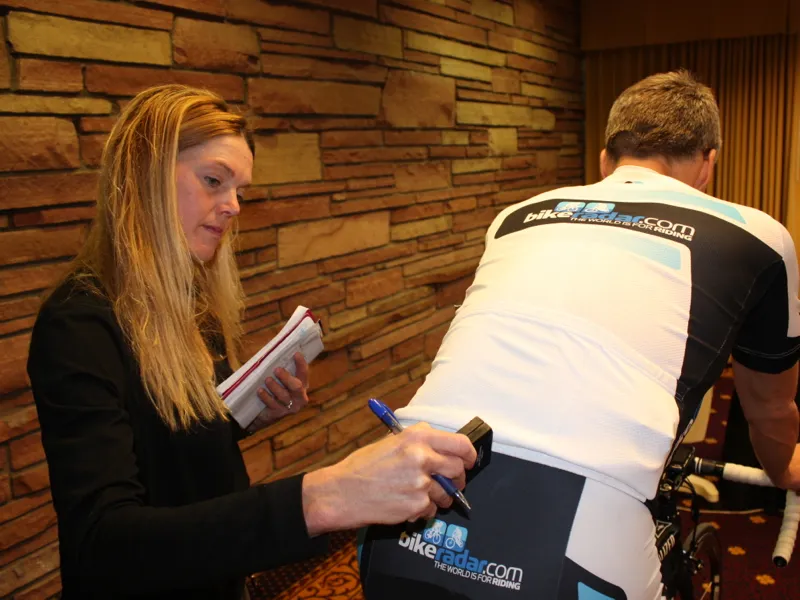
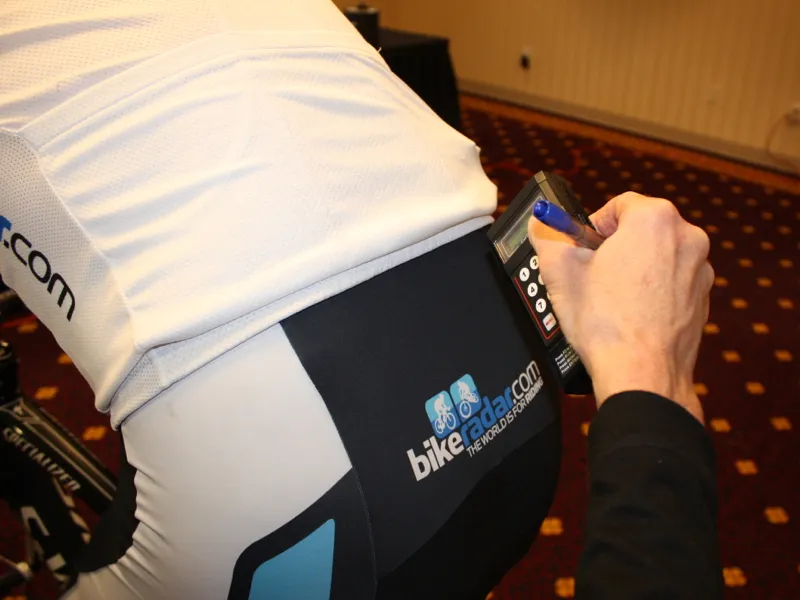
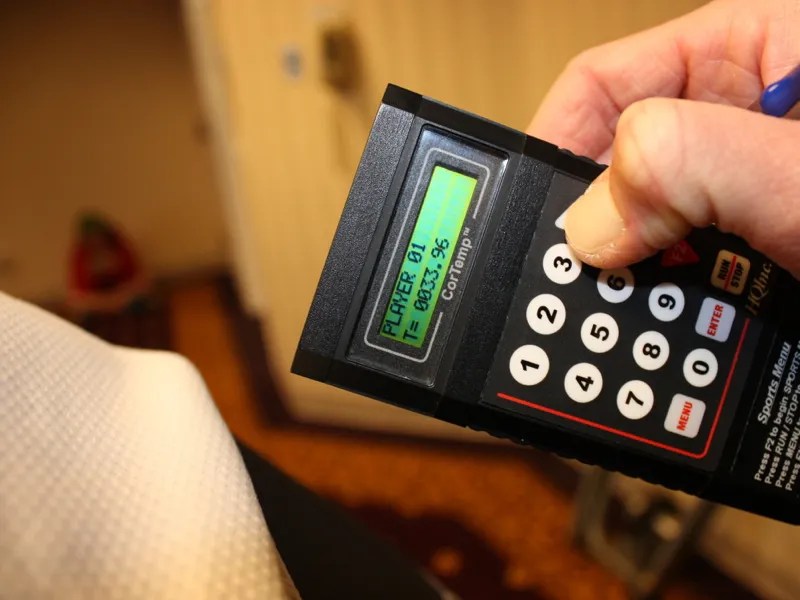
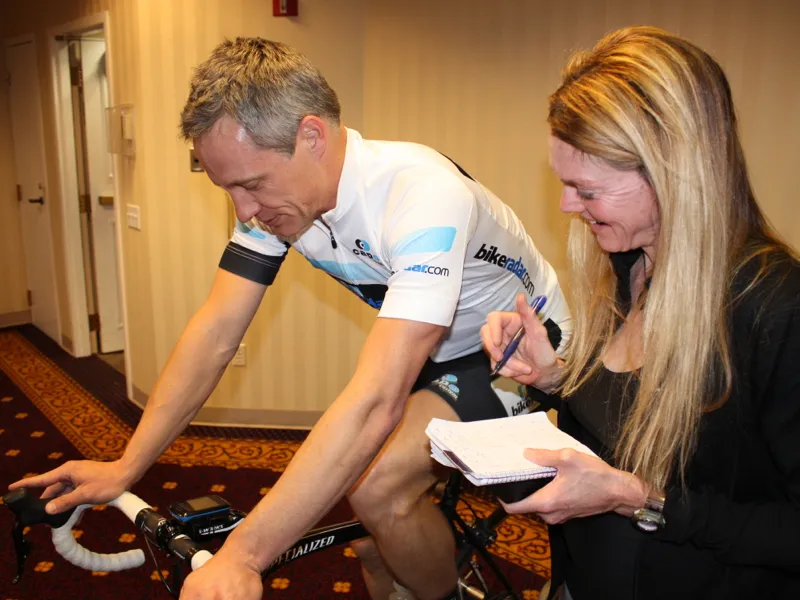
Dr. Sims taking a reading from the thermometer pill, now somewhere in my intestines
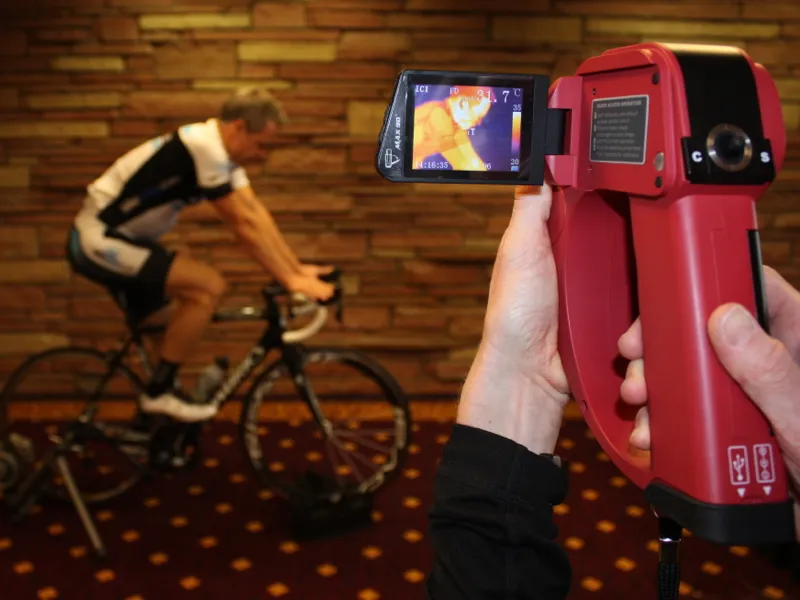
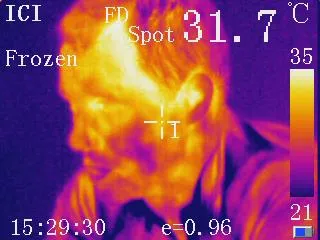
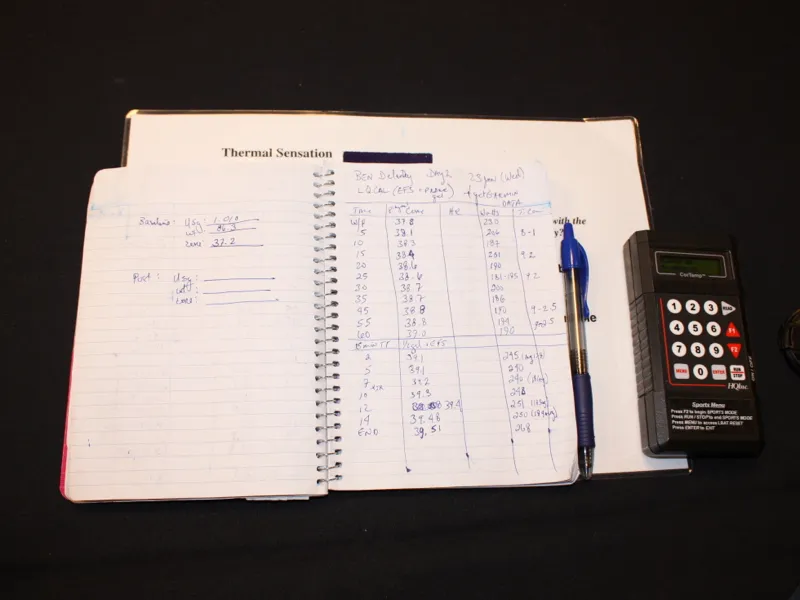
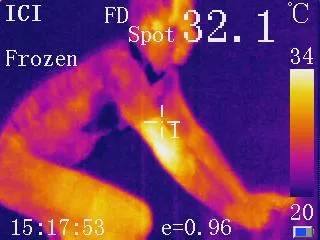
Throughout all the tests, Dr. Sims recorded our external and internal temperatures, plus our power output. Temperature readings were captured externally via an infrared device, and internally with a large-pill-sized thermometer that we swallowed. In the BikeRadar tests, power was measured with a PowerTap SL wheel and captured with a Garmin Edge 800.
The 60-minute steady effort was designed to deplete muscle glycogen and 'level the field' for the actual test, the 15-minute time trial.
In the BikeRadar test, I did the Osmo test first and the high-carbohydrate drink test two days later. In the 15-minute time trials, my cadence and exertion felt the same — I felt I was riding a TT pace — but the numbers told a different story. In both tests, I drank 2.5 bottles over the 75 minutes.
- Average power with Osmo: 298 watts
- Average power with the high-carb mix: 260 watts
- Core temperature with Osmo: 38.3℃ to 39.15℃
- Core temperature with high-carb mix: 39℃ to 39.5℃

While we could see the power readout during the 60-minute steady rides, Dr. Sims took the head unit for the 15-minute all-out time trials
Granted, this was just a single test, but a 38-watt difference in average watts at what my brain and body felt was the same exertion level? That got my attention.
Other test riders in Boulder reported similar differences.
Dr. Sims also measured my body weight and hydration levels (via urinalysis) before and after both tests. I was twice as dehydrated after the liquid carbohydrate test than the Osmo Clif Bar Bloks test.
Taking the 18 test riders together, the average 15-minute TT wattage with Osmo was 308 watts. With the high-carb beverage that number was 254 watts. For the core temperatures, however, the 18-man average was very similar for both tests. The Osmo tests averaged a 1.6℃ increase during the 60-minute steady ride, and a .35℃ increase in the 15-minute time trial. For the high-carb drink test, the comparable increases were 1.6℃ and .5℃.
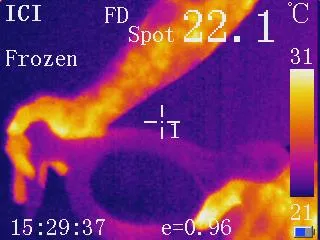
Hot hands signal overheating
In the BikeRadar test results, Dr. Sims was keen to point out how my skin temperature was cooler during the TT with Osmo, which she said indicates a greater sweat rate and better evaporative cooling. Also, the lower core temperature during the test with Osmo, Dr. Sims said, pointing to "greater systemic circulation of blood," which meant less competition "between blood flow to the muscle for metabolism and blood flow to the skin to offload heat."
During the two trials, the total calorie intake was very similar, but in the Osmo trial more of the calories came from the Clif Bar Bloks, while in the other trial the drink was heavier in calories. More to the point of the test, the Osmo drink mix had an osmolality of 275-280 mOsm, Sims said, while the other drink mix was about 330 mOsm. Blood is about 280-295 mOsm. "Knowing that physiologically the blood sits 280-295 mOsm, a fluid with an osmolality of greater than 280 will inhibit water absorption," Sims said. "Net flux of water will be from the vascular spaces into the digestive tract; resulting in a net decline of water absorption."
Note that Osmo does not have a monopoly on lower-osmolality drinks, and that the second drink in the test was chosen for its high osmolality. Dr. Sims set the test this way to underscore her hypothesis about the science at work. "Much to the chagrin of [my colleagues], I push education over product," she told BikeRadar.
Being a scientist, Dr. Sims can and does go on in detail about the nuances of hydration and physiology. My takeaway, however, was much simpler: Osmo works. My power was higher with Osmo and semi-solid fuel than with liquid carbs at the same perceived exertion.
BikeRadar test results
Hydration and Thermoregulation
- Test 1: Osmo PRE: POST:
- Urine Specific Gravity 1.010 1.018
- Body Weight: 87.0 kg 86.5 kg
- Core Temperature: 37.5°C 39.15°C
- Net change in Core Temp
- Steady State: 37.5°C 38.8°C Diff: 1.3°C
- 15 min TT 38.8°C 39.15°C Diff: 0.35°C
- Test 2: Liquid Calories PRE: POST:
- Urine Specific Gravity 1.010 1.025
- Body Weight: 86.3 kg 85.6 kg
- Core Temperature: 37.2°C 39.5°C
- Net change in Core Temp
- Steady State: 37.5°C 39.0°C Diff: 1.5°C
- 15 min TT 39.0°C 39.5°C Diff: 0.5°C
Power:
- Test 1: Osmo 60 min Steady State: 15 min TT:
- Average: 188 watts 298 watts
- Min: 179 watts 278 watts
- 1 min peak power: 222 watts 322 watts
- Rate of Decline 24 watts
- Test 2: Liquid Calories 60 min Steady State: 15 min TT:
- Average: 189 watts 260 watts
- Min: 172 watts 240 watts
- 1 min peak power 208 watts 297 watts
- Rate of Decline 37 watts
