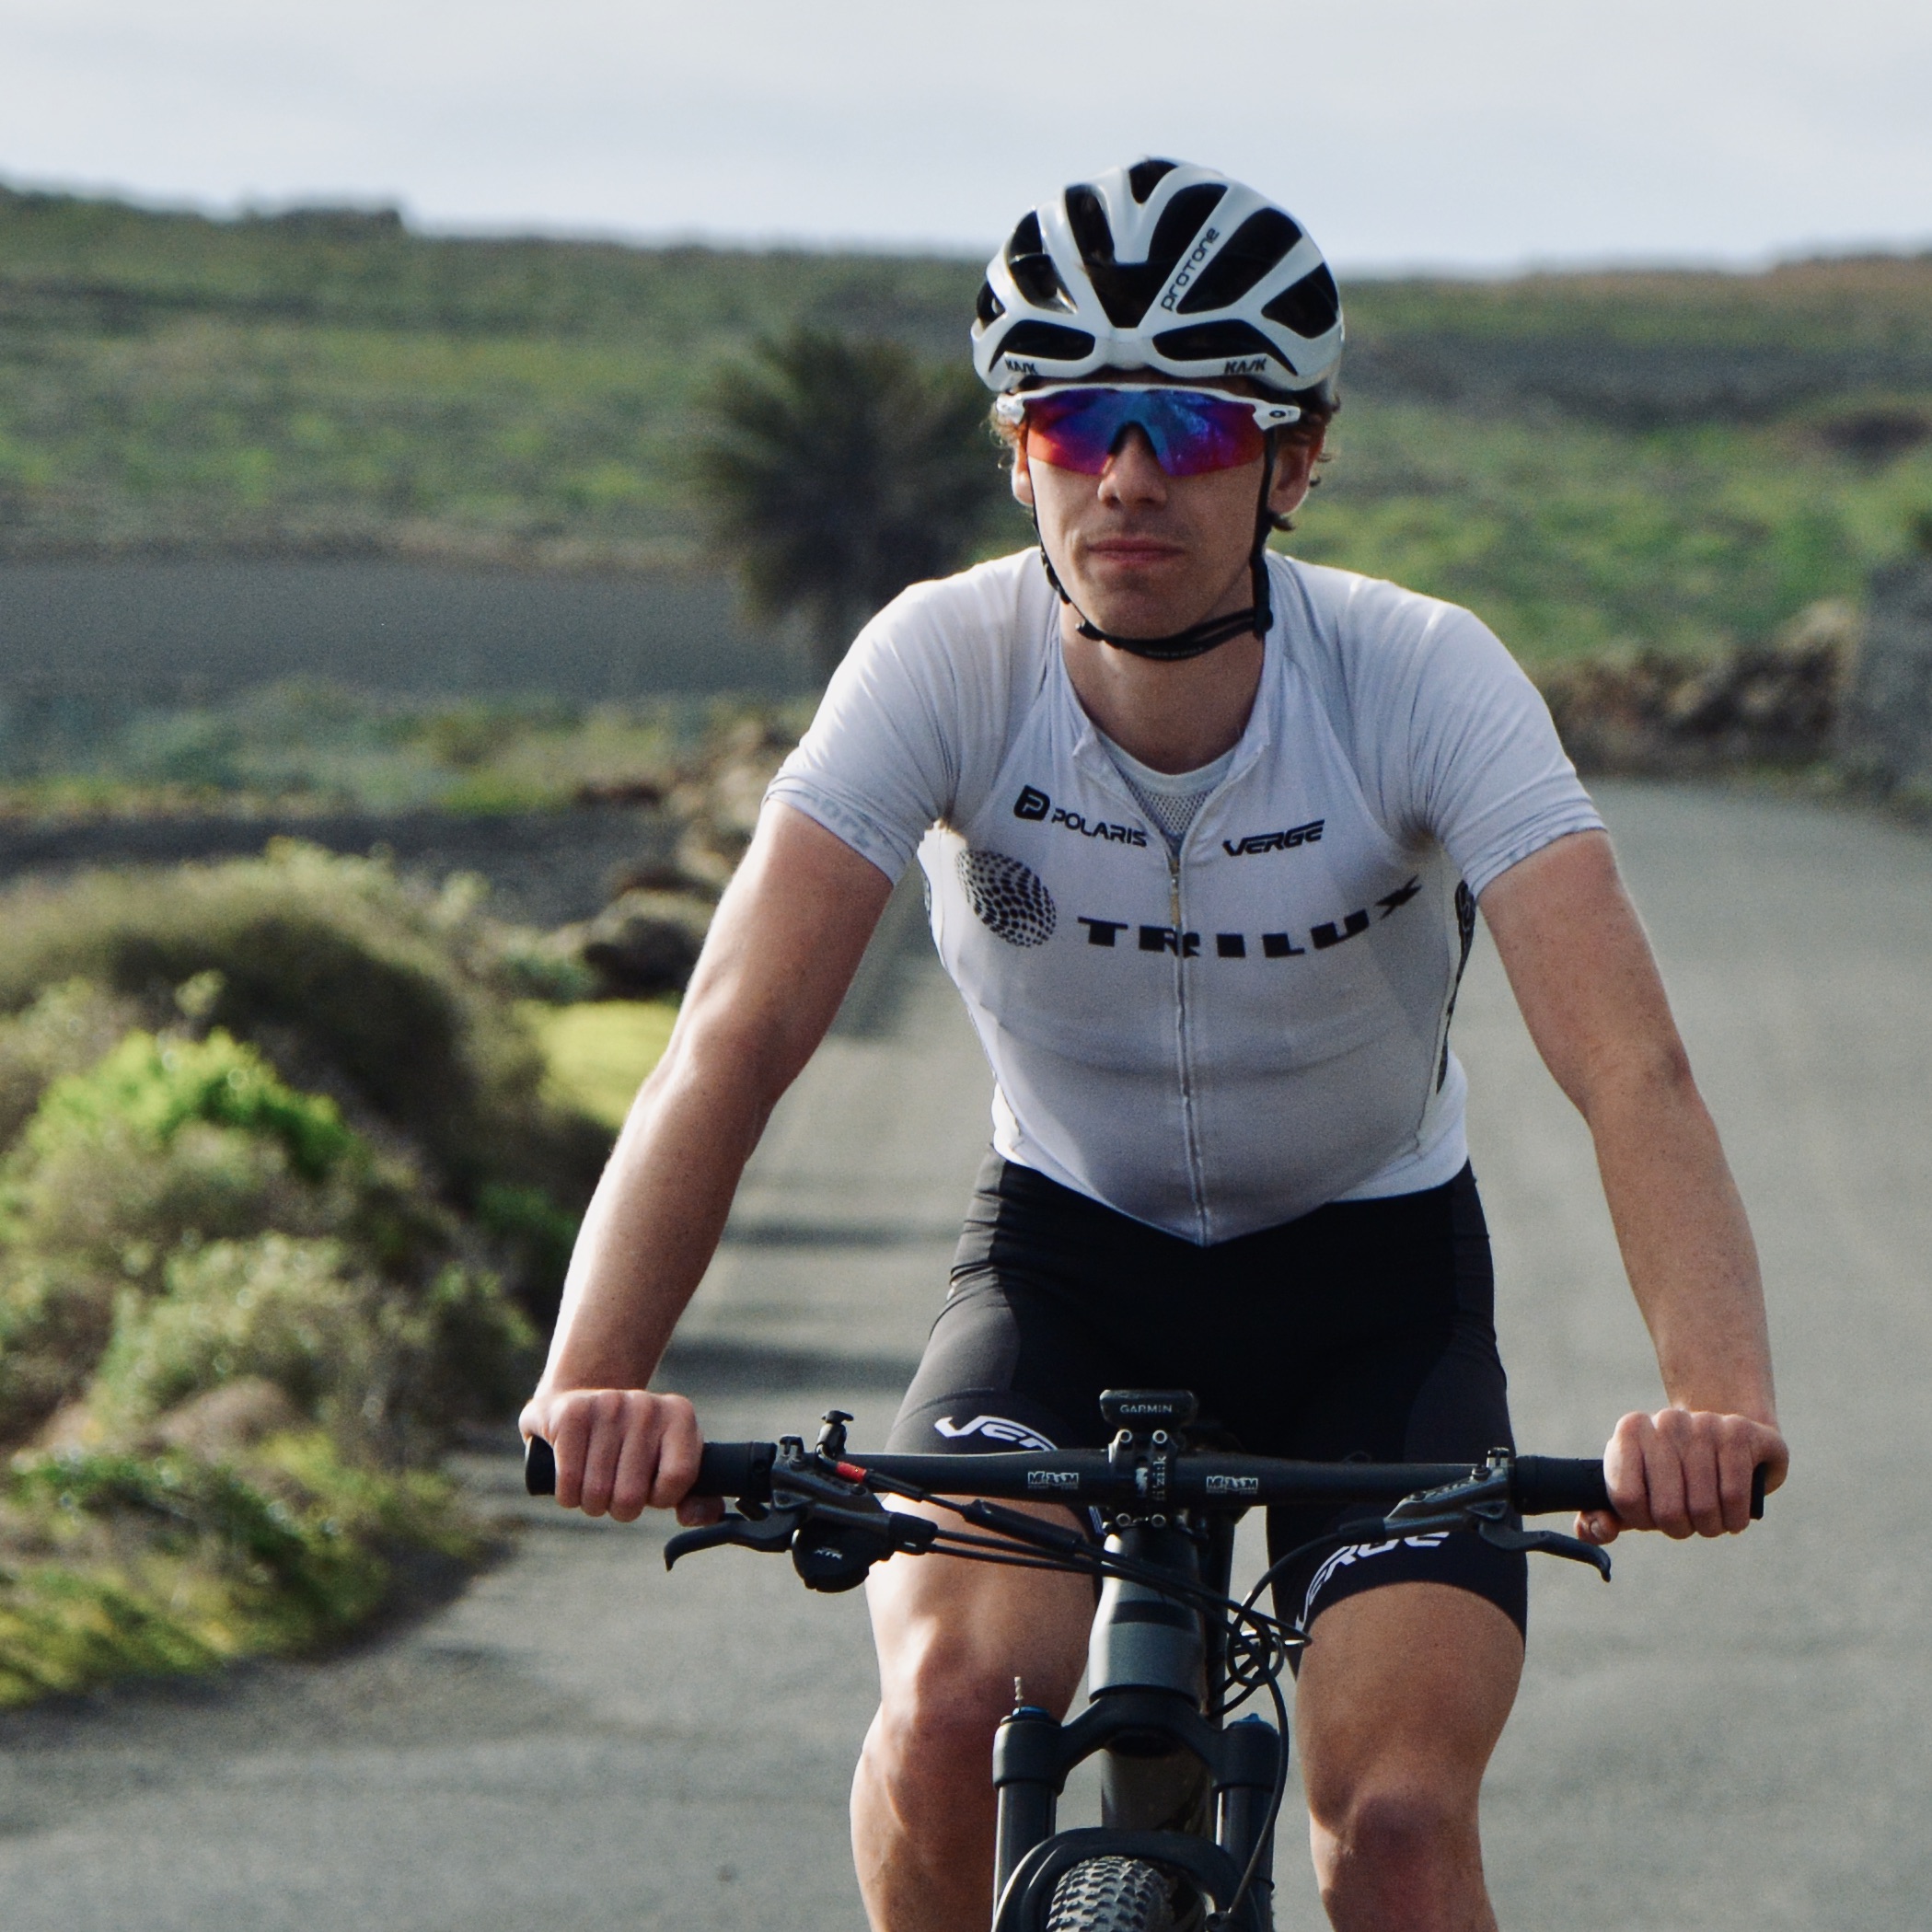
Cyclists have more training data at their fingertips than ever, as well as an ever-complex web of information on how to use that data, but could Rating of Perceived Exertion be the gadget-free metric you’ve been missing?
Just under 50 years ago, Polar developed the first heart-rate monitor for use in training, opening up data-driven training for cyclists wanting to monitor their effort level outside of a laboratory setting. This was followed nearly a decade later with SRM’s launch of the first power meter.
Power and heart rate are now commonplace among cyclists as a means to use training zones to monitor intensity and target specific physiological adaptations (you can read our guide on training with power vs heart rate).
We’re also seeing more innovative technologies that can measure values such as ventilation rate, muscle oxygen saturation, and heart rate variability during exercise, and apply complex algorithms to determine training intensity zones on the fly.
However, while these technologies are undoubtedly useful, should we also be taking a more back-to-basics approach to monitoring training intensity?
More specifically, Rating of Perceived Exertion (or RPE) is an under-rated training metric that should always be considered, irrespective of how many sensors you have monitoring you. What’s more, you don’t need another gadget to measure RPE and use it as a metric to inform your training.
With that in mind, here we’ll take a look at RPE, why it’s important, and how to integrate it into your training.
What is RPE?
RPE is simply an indication of how hard a session feels subjectively. It’s often quantified numerically (e.g. a 6/10 effort). However, it could also be descriptive (e.g. ‘very easy’, ‘all-out’ etc.).
How to measure RPE
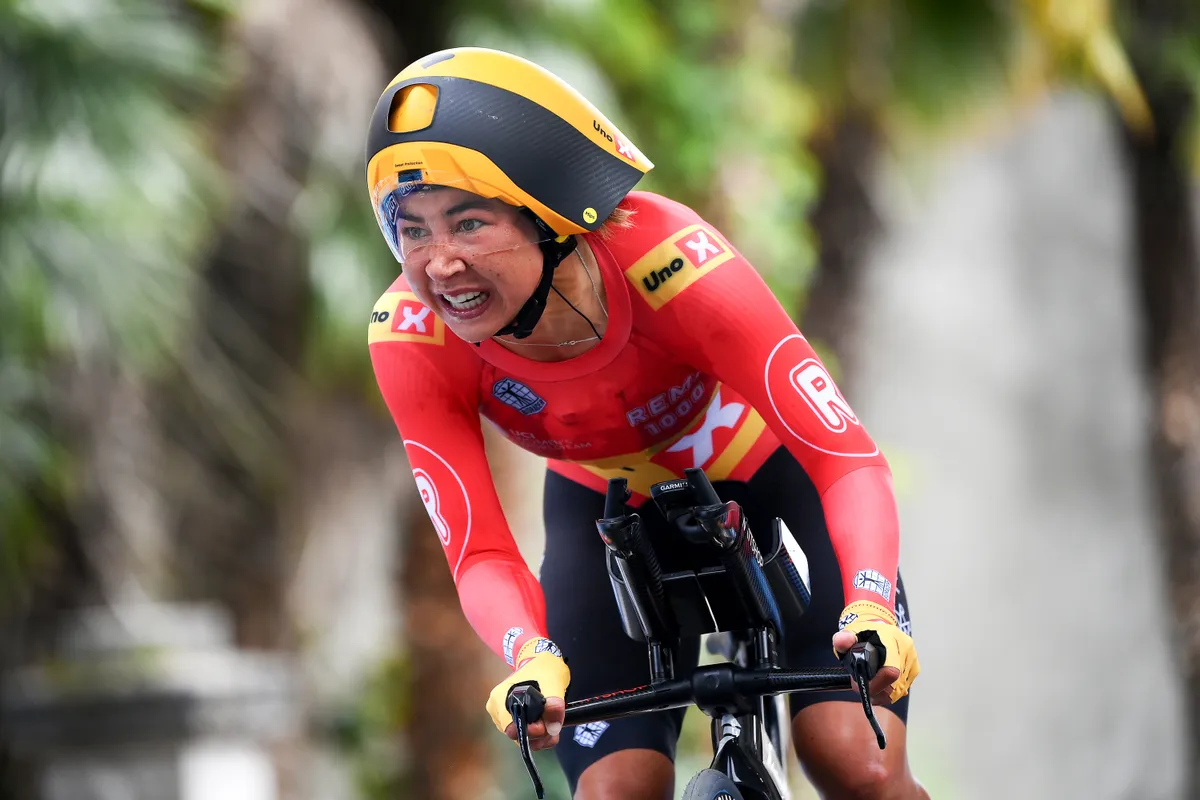
The traditional approach to measuring RPE is to use something known as the ‘Borg Scale’, where exercise intensities are graded on a scale of 6 to 20. 6/20 represents little or no effort at all, and a 20/20 is a maximal effort.
The Borg Scale is well-validated and used extensively in research, but it can also be quite a confusing scale to use. A more practical approach is to grade exercise intensity on a scale of 1-10.
This is what we’d recommend using, and we’ve included a table below, so you can get a sense of what the different intensities should feel like.
| RPE level | Brief descriptor | Detailed description |
|---|---|---|
| 1 | Almost no exertion | These levels feel very light. You can breathe comfortably, and speak in full sentences. There is no sense of burning in your legs, and you feel you can maintain this effort level for many hours. As you approach levels 3 and 4, you might become more conscious of a feeling of ‘tension’ in your muscles, and the fact you’re having to focus more on contracting your muscles hard enough to maintain the effort level, but this is still very comfortable. |
| 2 | Very, very easy | As above |
| 3 | Very easy | As above |
| 4 | Easy | As above |
| 5 | Moderately easy | Breathing rate is elevated. You can still speak, but only short/broken sentences. You may feel some low-level burning in your legs, and a sense of muscle tension, but this feeling remains at a stable level and is easily tolerable. It feels like you’re working harder, but could maintain this effort for an hour or more under race/competitive conditions. You have to focus moderately hard to keep maintaining this intensity to avoid dropping down to a lower effort level. |
| 6 | Moderately challenging | As above |
| 7 | Challenging, but sustainable | This effort is on the cusp of what feels sustainable – it’s an effort that you should be able to hold for around 30-60 minutes under race-like conditions. Your breathing will be elevated, and you’ll only be able to speak very short, broken sentences. Your legs are burning, and they will start to feel quite fatigued after 15-30 minutes riding at this intensity. |
| 8 | Hard | At these intensities, an effort is only sustainable up to roughly 15-20 minutes, at most. Your breathing will be very heavy, and you’ll struggle to speak more than single words. You’ll notice a burning sensation in your legs, which quite quickly escalates. |
| 9 | Very hard | As above |
| 10 | Max exertion | This is an all-out effort lasting up to a few minutes at most. Think anything from a sprint to a 1-min max effort. |
Why is RPE useful?
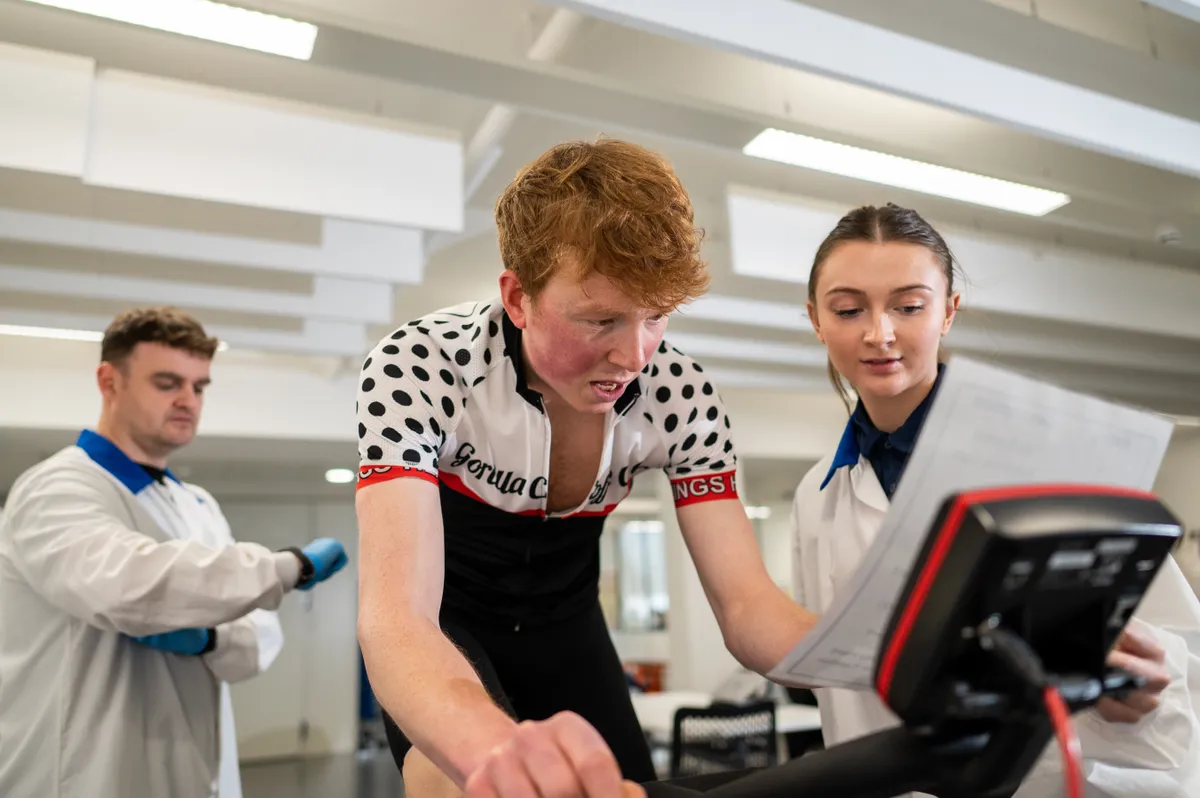
Fundamentally, RPE is arguably the most sensitive and all-encompassing indicator of training load; particularly for the so-called ‘internal training load’.
Understanding internal and external training loads
By ‘internal training load’, we mean the load or stress that’s applied within the body, which encompasses the energy systems being used, the levels of fatiguing metabolites within the blood, the types of muscle fibres being activated, the stress on the central nervous system, how hard the body is working to regulate temperature and so on.
This is in contrast to ‘external training load’, which is simply the amount of actual work you’re doing to push the pedals, measured as the watts you’re producing, multiplied by the length of time you’re riding.
Internal and external loads are not necessarily the same.
For example, riding at 200 watts when you’re rested, well-fuelled, hydrated and in a cool environment results in a very different internal load to riding at 200 watts at the end of a hot, hard race which has depleted your muscle glycogen, damaged your muscles, caused dehydration and elevated your body temperature.
We all intuitively know that the stress on the body is greater in the second scenario because it feels harder to push the pedals under these conditions. This nicely illustrates the power of RPE.
Using heart rate to capture internal training load
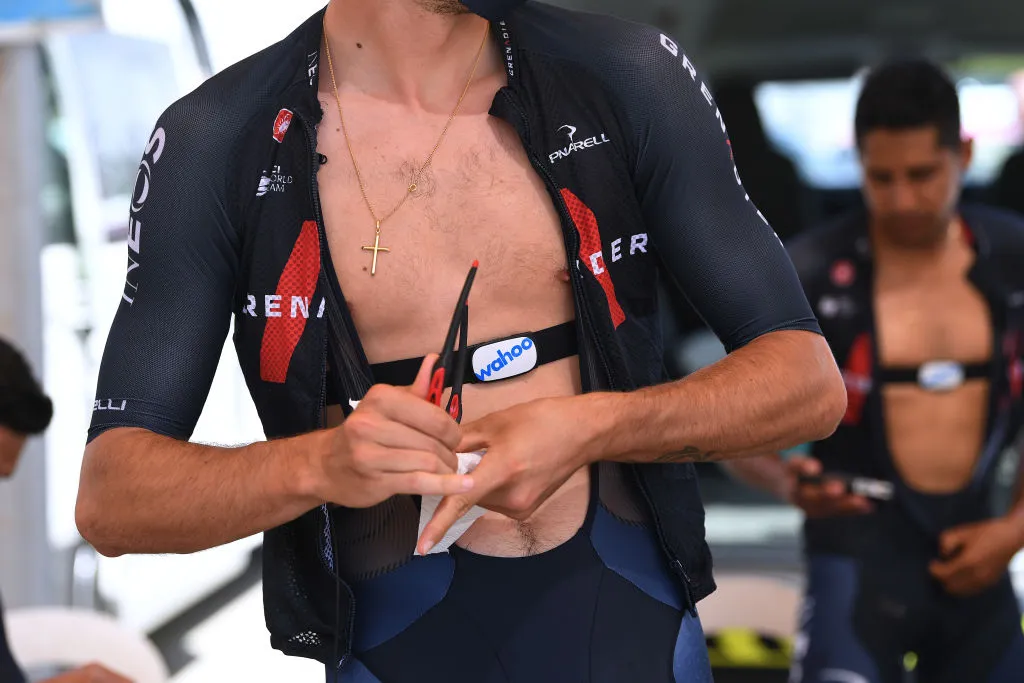
Internal training load (the stress felt by the body) can also be captured to some extent by measuring heart rate or using the other technologies we mentioned above.
For example, we often see heart rate drifting upwards towards the end of a long ride, even when power output is kept constant. This tends to reflect the increased internal load arising from muscle fatigue, glycogen depletion, dehydration and increased body temperature.
In this example, at the start of the ride, you might be able to hold 200 watts at a heart rate of 145bpm, whereas at the end of the ride that same 200 watts requires a heart rate of 155bpm.
The stress on the body is higher in the latter instance, and you might want to adjust your power targets accordingly when you start to see signs of heart rate drift (this is also known as ‘cardiac drift’).
Enter, RPE
However, heart rate has some drawbacks. Most notably, it only reflects stressors that have an impact on the cardiovascular system and isn’t so good at capturing other stressors such as neural fatigue and muscular damage, for example.
The same is true of the other measures mentioned above (e.g. ventilation or muscle oxygen saturation). All methods for objectively measuring internal load so far only give a narrow snapshot of what’s going on in the body.
RPE, on the other hand, arguably represents a more holistic picture of how hard you’re working. Crucially, for everyday cyclists, it’s also free, easy to use and can help you make better sense of your heart rate and power data and any discrepancies you see between the two.
How to use RPE in training
There are two key ways that you can use RPE in training: monitoring your 'form' and readiness to train; and individualising training intensity targets.
Monitoring your ‘form' and readiness to train
Using RPE on a day-by-day basis can help you assess your readiness to train. With this, we’re looking in particular for discrepancies between your RPE and measures of internal/external training load such as power or heart rate.
For example, if you start a session and notice that your RPE feels high relative to your power output and/or heart rate, then this might be a sign that you’re not sufficiently recovered for a high-intensity session.
This might mean changing up your plan a bit, perhaps taking a recovery day, doing a low-intensity ride, or postponing any high-intensity training until later in the week.
Individualising training intensity targets
As we’ve already covered, many riders now train and race using power and/or heart rate zones.
While these are excellent for giving you a ball-park intensity range to work within, they are rarely perfect, and often need some fine-tuning to suit your own unique physiology.
Paying attention to RPE can be a smart way to do this – and, in fact, RPE can often be used as the primary intensity metric when pacing high-intensity intervals.
Some common session types are listed below with their associated RPE level.
| Session | Usual power & heart-rate range | RPE |
|---|---|---|
| Recovery ride | 45-60% FTP / 50-60% max HR | 1-3/10 |
| Long ‘zone 2’ endurance ride | 55-75% FTP / 60-70% max HR | 3-4/10 |
| ‘Tempo’ or ‘sweetspot’ | 75-98% FTP / 70-80% max HR | 5-6/10 |
| Threshold intervals | 95-102% FTP / 80-90% max HR | 7/10, possibly building to 8/10 towards the end of the session |
| Intervals above threshold (e.g. VO2 max) | >103% FTP / >90% max HR | 8/10, possibly building to 9/10 towards the end of the session |
Five tips to get the most from RPE
Having learned how Rating of Perceived Exertion can be used to enhance your training, let’s wrap up with some tips on how to get the most from this valuable metric.
1) Keep a record of your RPE for a whole session
Keeping a record of your RPE can help you monitor whether you’re allowing enough time to recover, and also spot potential warning signs of illness.
For example, if you’re consistently seeing RPE ratings of 7-9/10 for sessions that should feel more like 4-6/10, then this is concerning and you might need to take a step back to see whether you’re allowing enough recovery, or perhaps pushing yourself too hard in training.
Training platforms such as TrainingPeaks allow functionality to quickly record your RPE at the end of each session.
2) Don't focus exclusively on single metrics
Rather than exclusively using power, heart rate or RPE, try to triangulate all the information you have on training intensity to form a better picture of how hard you’re working and what your form is looking like.
For example, if you notice that your heart rate is low relative to your power, and your RPE is high, you might conclude that you’re a little fatigued, or that you might be seeing early signs of illness.
In contrast, if your heart rate is low relative to power, but your RPE is also low, this could be a positive sign that you’re feeling fresh and that fitness is improving.
Without consideration of RPE, we wouldn’t be able to differentiate between these two very different scenarios as easily.
3) Be reactive to your RPE
This means being willing to adapt your plan day by day based on how you feel. It doesn’t make sense to persist with a high-intensity training session if you’re simply not fresh enough to perform this session well, for example.
4) Hone your RPE skills for use in competition
Take a mental note of what different effort levels feel like in training and how long you can maintain these efforts. Then keep checking in with yourself during your races or events to make sure you’re keeping the effort to one you know you can maintain.
5) Use RPE to help with power control
When it comes to RPE, it’s possible to drill down to what each individual pedal stroke feels like, and this can be a great way to help keep your power under control when training.
Once you’ve done a few pedal strokes at your target wattage, try to remember what this wattage feels like, and aim to emulate that with each subsequent pedal stroke.
