This feature was originally published in issue 386 of Cycling Plus magazine.
Science & Cycling is an annual conference that brings together cycling’s finest coaches, exercise physiologists and academics to reveal what’s happening at the tip of the peloton, while flagging up what lies ahead down the road.
It’s usually held for two days in the week prior to the Tour de France’s Grand Depart, but Covid forced a change this year to Leuven, Belgium, just prior to the World Championships.
And, despite the labyrinth of passenger locator forms, PCR tests and general Covid confusion, we were there to find out how you can ride stronger and more comfortably in 2022...
1: Learning from the track
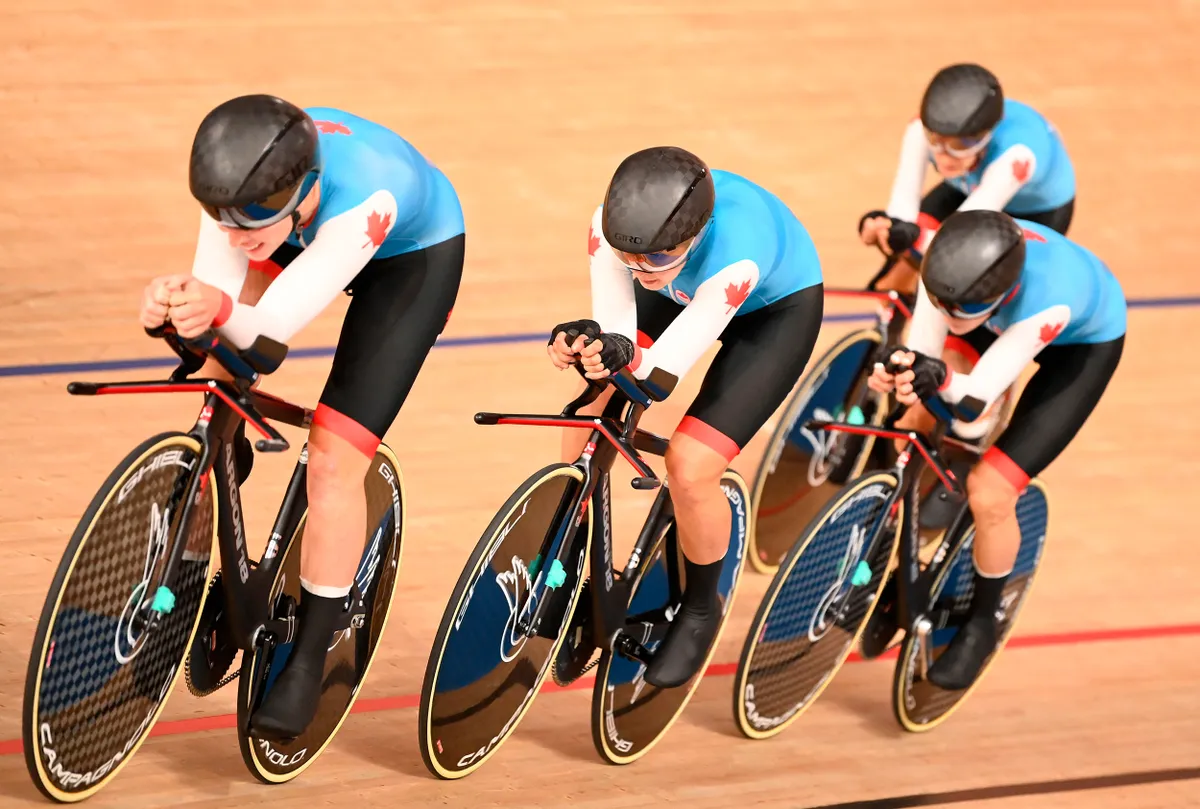
Kurt Bergin-Taylor is a former student at Loughborough University, has a PhD in exercise physiology and worked on Cycling Canada’s Olympic track programme before taking up his current role as trainer at Team DSM.
He’s a man who successfully marries academia and real-life application, and says all roadies can learn from his time in Canada.
“We had a relatively disappointing Worlds in Berlin [2020] and what we noticed – especially the women – was that we were really struggling over the first two laps,” recalls Bergin-Taylor.
“Our flying starts were comparable with the best, but our standing starts weren’t. We didn’t have the ability to generate force early on and it was costing us. I wanted to understand why.”
Key to uncovering the problem was the uniqueness of a track bike and its fixed gear. With no gears to rapidly shift through from stop to start, that makes torque – essentially a measure of force acting on the pedals to make the wheels rotate – incredibly important.
Bergin-Taylor played around with gym work, but it wasn’t “muscle-specific” enough.
“We needed on-the-bike work for a very short period of time, so we designed a protocol via the Tacx Utility app. On there, you have an isokinetic mode, where no matter how much force is exerted, the speed is fixed, so it’s useful to train at low revolutions per minute (rpm).
"You also have the isotonic mode, which helps you to apply constant force through the pedal stroke.”
Twice weekly, the Canadian riders’ strength training was replaced with three sets of four-second maximal effort work, comprising up to 12 repetitions each time, with two minutes of rest between sets.
“It was a disgusting session, but it paid off, as 66 per cent of the participants racked up 3km individual-pursuit personal bests,” says Bergin-Taylor.
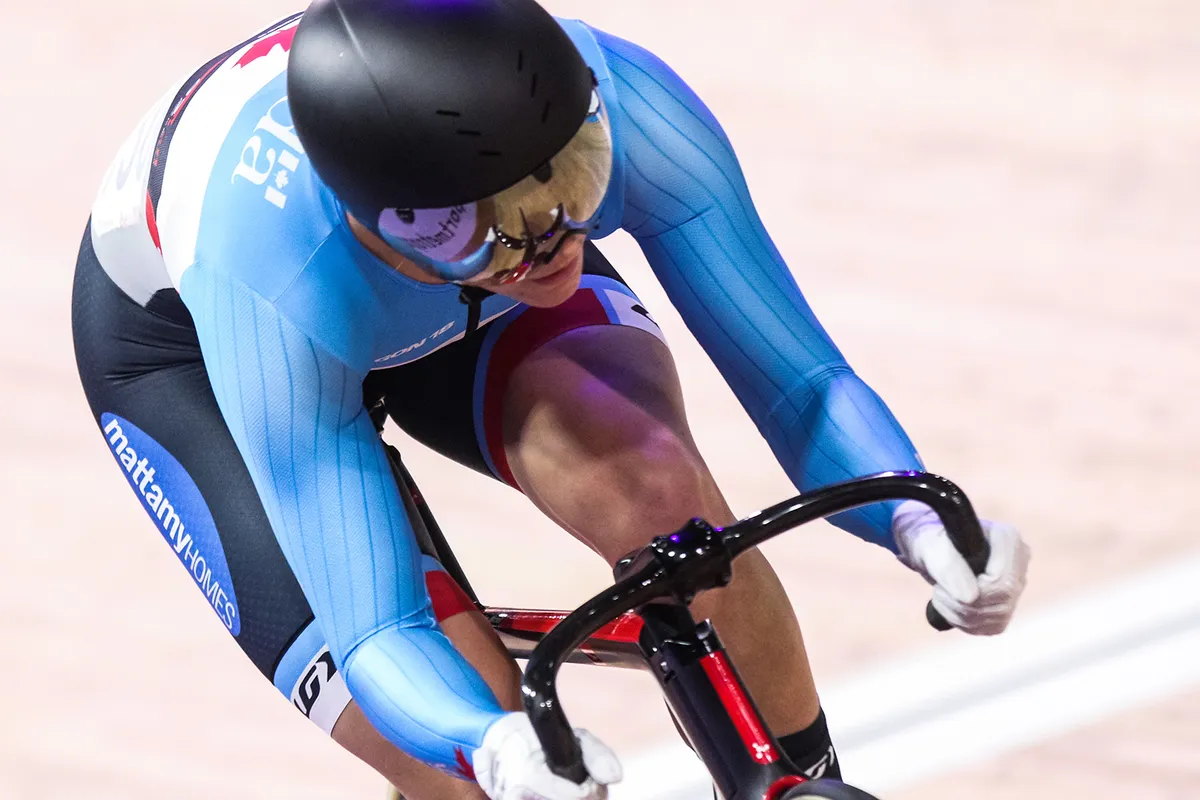
Kelsey Mitchell, who rode in the velodrome for the first time in 2018, even went on to win sprint gold at the delayed Tokyo Olympics.
Bergin-Taylor concedes it’s much harder to assess your torque generation through the pedal stroke on the road, but it is possible, “though requires much cleaning up of data”.
What’s clearer is that we can all benefit from increasing torque, whether that’s to accelerate from your mates or laying down the hammer uphill. Adapting Bergin-Taylor’s session, over-gear work and low-cadence intervals all help here.
“You should play around with cadence and gear selection, too,” Bergin-Taylor insists.
“We know certain sprinters assume they reach maximal power at 120rpm, but if we dial down into the data, we see they’re actually sprinting at 100rpm because they shove the gear down into 54/11 every time.
"We then start to educate them and say it’s fine to shift down to 54/13, as you’ll hit 120rpm and cycle faster.”
2: Your aero future
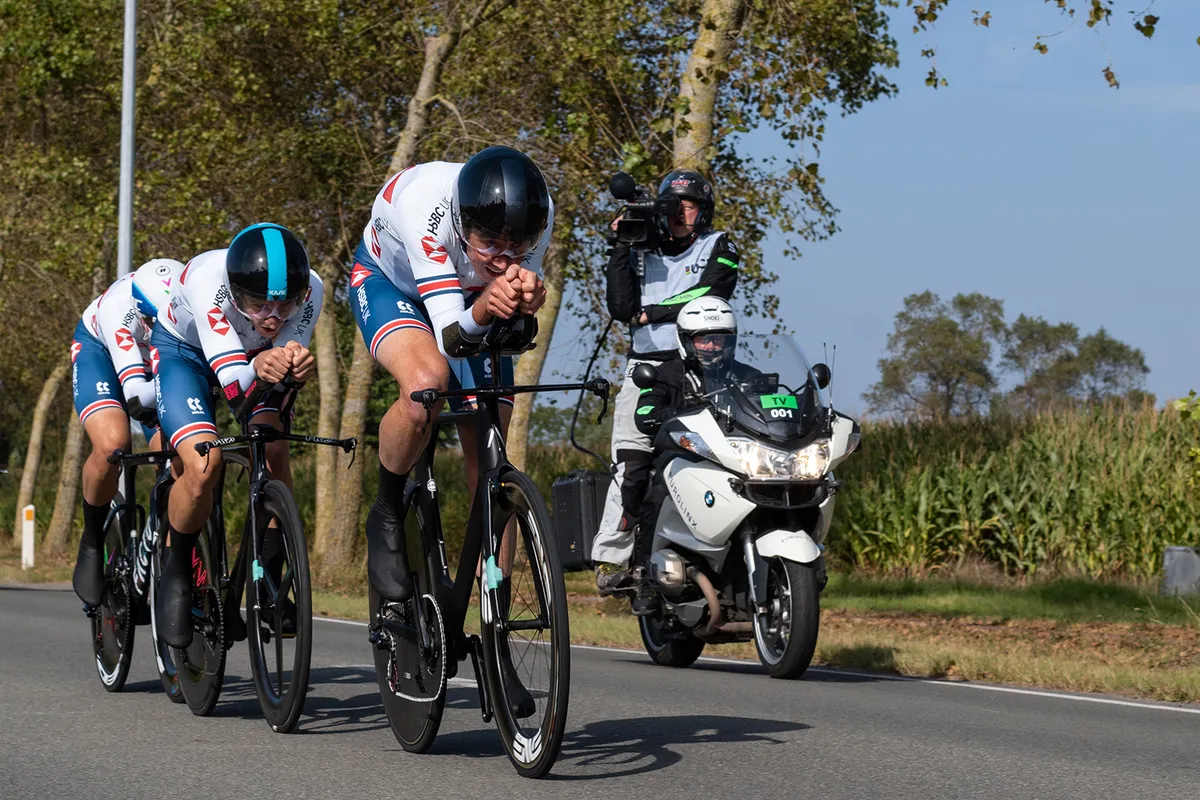
Wattshop was created by Dan Bigham, the new British Hour record-holder. Bigham broke Sir Bradley Wiggins’ record in October 2021, riding 54.723km in Grenchen, Switzerland, a day after his partner Joss Lowden set a new women’s hour record.
Bigham’s known as a disruptor and was spotted at the recent mixed relay time trial at the Worlds with something stuffed down his jersey.
Cycling commentator Michael Hutchinson referred to it as a “gigantic monoboob”.
It was revealed soon after to be a radio built into a massive padded pocket to improve aerodynamics. But that wasn’t the sole aero advantage Bigham was seeking in Flanders.
“We supported Dan at the Worlds,” explains Kelly Zwarych, co-founder of slipstreaming pioneers AeroLab Technology, “specifically on the course reconnaissance.”
Zwarych helped to create the water-resistant data logger that sits beneath aerobar extensions, and provides real-time measurements of all the metrics that time triallists are constantly looking to improve for faster times: aerodynamic drag, coefficient of drag area (CdA), coefficient of rolling resistance (Crr), wind speed, wind yaw angle, wind gusts, plus estimations of drivetrain loss.
In short, it provides a next-generation analysis of aero peformance, taking wind-tunnel feedback into the real world.
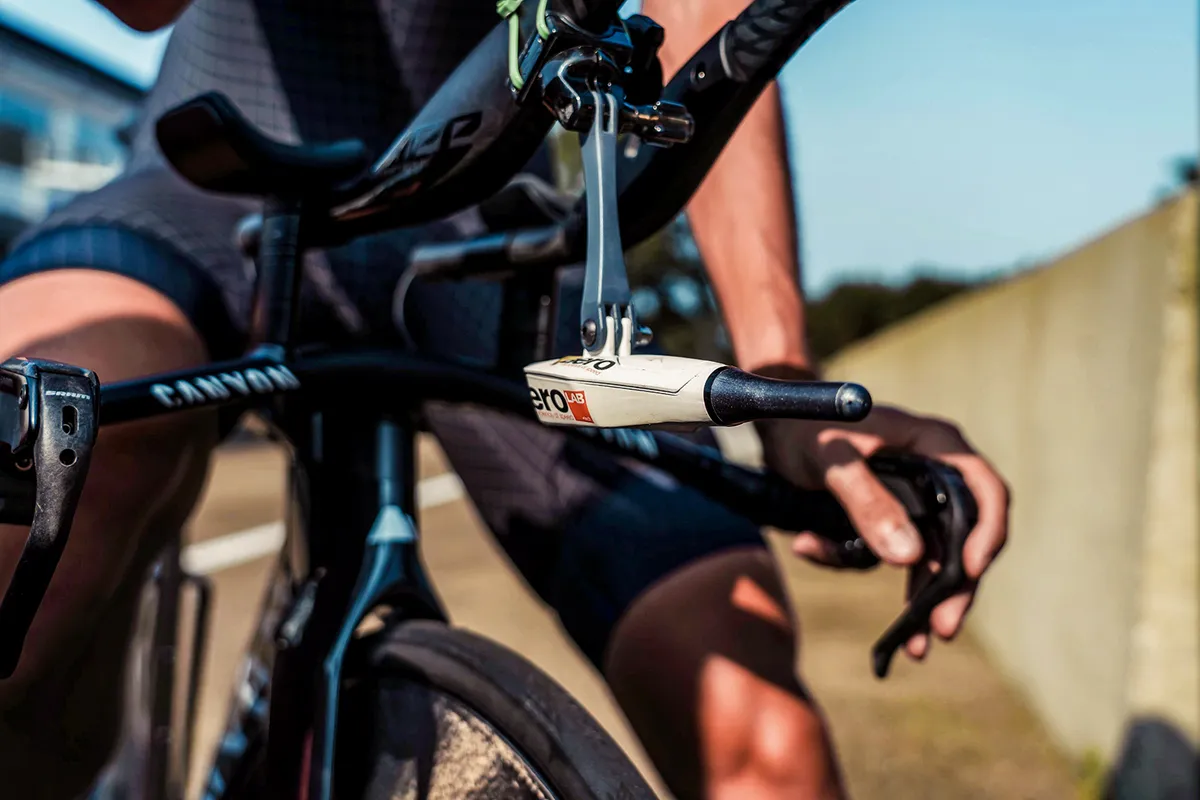
It’s all designed to answer peak-performance questions: which equipment’s best suited for a given race? What tyres and pressure are best for any given set of wheels? Will a disc wheel really be faster? Why was I slower during the second half of my race but my power was higher?
“Let me show you an example from Ironman [triathlon] racing to highlight the importance of aero,” says Zwarych.
“Two of the best – Lionel Sanders and Jan Frodeno – roughly use the same equipment, weigh the same and generate a similar power output, so as Lionel’s shorter, you’d expect him to be faster.
"But Jan’s often eight minutes faster over the 180km bike [leg of a triathlon]. Looking at Lionel’s power output, we can estimate his CdA and, if he reduced that by around 0.019, he’d be neck-and-neck with Frodeno and fresh for the run.
"This shortfall could be as simple as using the wrong tyres, helmet or hand position.”
Currently, this assessment’s focused on the peak of the performance pyramid, with a six-month lease of the product coming in at nearly $3,000.
There are plans for a more affordable Aero-Lite product to hit the market in spring 2022. This will be under $400 (with UK prices to be confirmed).
In the meantime, simple aerodynamic tweaks every recreational rider can make include wearing close-fitting clothing, zipping up your jersey, spending more time on the drops and shaving your legs.
03: It's not all about the bike
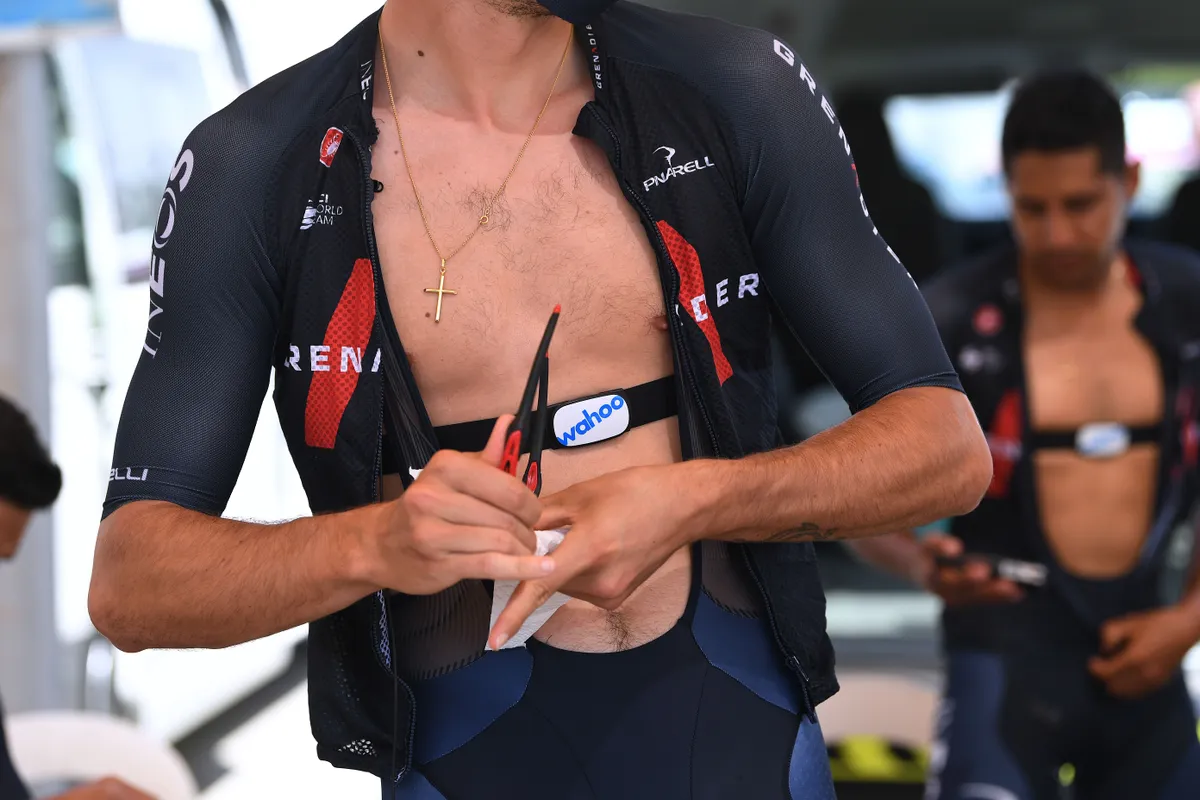
The wonderfully named Ruby Otter is a lecturer in physiology at the University of Groningen, with a particular interest in the physiological repercussions of stress on endurance performance.
In one study, Otter and her team monitored 150 cyclists, triathletes and runners for two years, asking them to complete a questionnaire, as well as logging their training and using the rate of perceived exertion scale [in Otter’s, 6 is very light; 20 is maximum exertion] to gauge effort.
“We chronicled four areas of stress and recovery: everyday stress, general recovery, sports-specific stress and sports-specific recovery,” says Otter.
“From this, we could calculate a recovery-stress score. We found that as general stress increased, performance suffered. On the other hand, if an athlete’s happy with training and life, they see a performance increase.”
Another study followed a group of runners who’d endured a “negative life event, though I can’t say what because of ethics”.
What Otter did reveal was that the group’s running performance dropped by an average 3.6 per cent, plus oxygen consumption cranked up despite running at similar speeds. “Somehow, stress had altered their coordination.”
Why isn’t entirely clear, though a rise in cortisol levels is associated with impaired performance. What’s clearer, says Otter, is that training too intensely when life becomes stressful is a path to overreaching, even overtraining. If your performance is plummeting, and you’re irritable and recovering slowly, you could already be there.
But if you want empirical evidence, use the sub-maximal test utilised by Otter: the LSCT Test, created by one of the comperes of this year’s conference, Rob Lambert.
It’s a 17-minute sub-maximal effort on an indoor trainer that requires either a heart rate monitor or power meter.
Cycle for six minutes at 60 per cent of your maximum heart rate (HRmax); six minutes at 80 per cent HRmax; and three minutes at 90 per cent HRmax.
Alternatively, this translates to 50 per cent, 72 per cent and 96 per cent of functional threshold power, or FTP, if you train by watts.
There’s a 30-second buffer between stages, leaving you to finish with 90 seconds where you stop cycling and sit up, so you can monitor your heart-rate recovery (HRR).
It’s this final minute that’s perhaps the most telling indication of whether you’re fit to cycle as, if your heart rate struggles to return to normal levels, it’s a sign you’re potentially on the verge of overtraining.
Over time, you’ll notice what your average heart rates are over the first three active stages, becoming your own affordable cycling coach.
It’s a great way to measure stress and impact training workload accordingly.
04: Ride to your strengths
“Your little Bert comes to you and wants to take up cycling. But which discipline? A mountain biker? Or hit the track? Or a roadie? Little Bert asks his parents. He asks his friends. They give him different answers.
"Wouldn’t it be nice for little Bert if he could know exactly which discipline his muscle type was more suited to? Well, now he can…”
Those were the words of Eline Lievens, a post-doctoral researcher in exercise physiology and sports nutrition at Ghent University.
Lievens has spent the past few years delving deep into athletes’ anatomy but, thankfully for said athletes, not via the traditional technique of muscle biopsy.
Though it’s the gold standard, it requires extracting a muscle fibre from the leg via a long needle and can ascertain an athlete’s muscle typology; in other words, whether they’re a slow-twitcher or fast-twitcher.
“My professor [Pro Wim Derave] has invented a non-invasive technique to measure muscle typology by placing an athlete into a scanner and measuring their carnosine levels,” says Lievens.
“Carnosine, which is a protein building block, is found to be more readily available in fast-twitch fibres.” Vis-à-vis, high carnosine equals a prevalence of powerful fast-twitch fibres; low carnosine equals a prevalence of less powerful but more stamina-packed slow-twitch fibres.
Why is knowing this split important? As little Bert now understands, talent ID is one reason, albeit there are definite ethical arguments around enforcing your child to choose a sport that matches their genetics rather than what their friends are doing.
“It can help at an older age, too, as you might not be riding the discipline that you’re genetically best at,” adds Lievens. “We scanned 80 cyclists from road, track, mountain biking and cyclocross, and showed a correlation between disciplines.
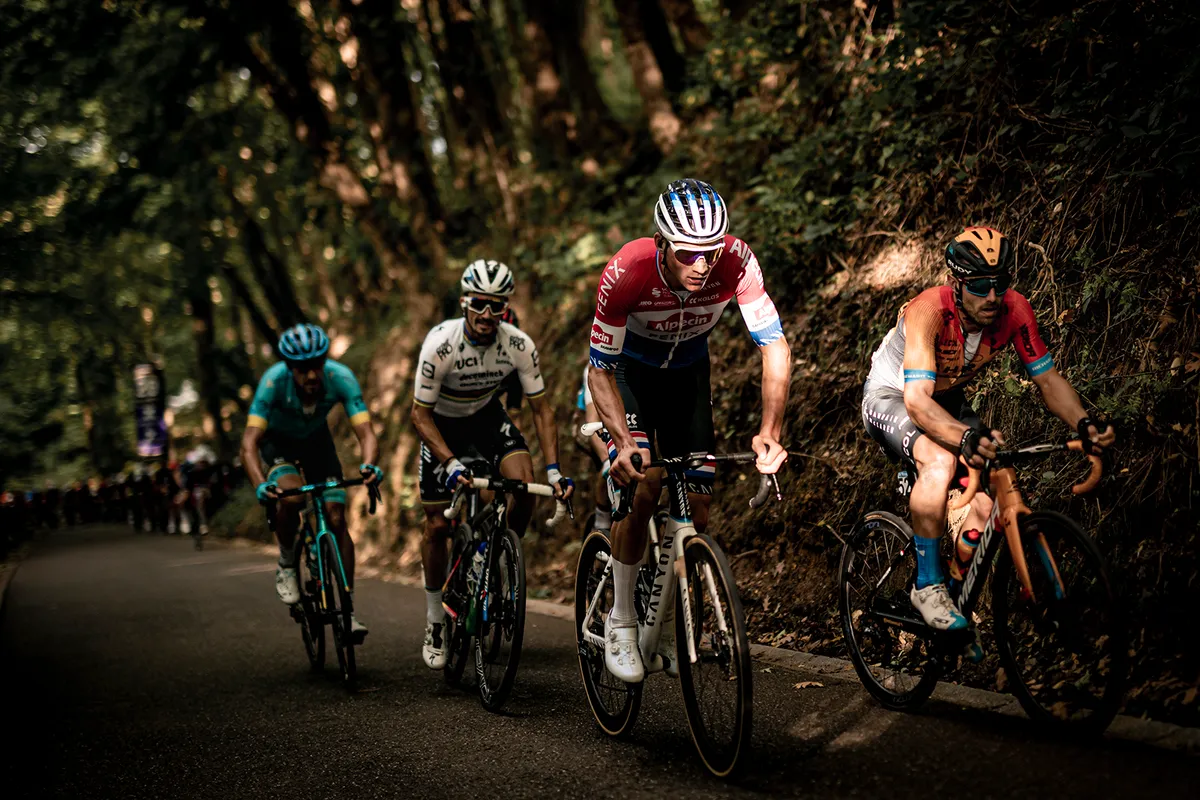
"Athletes deemed intermediate or fast typology performed well in BMX and track sprinting. Those with an intermediate and slower typology did well on the road and cyclocross.” This partly explains the success of Mathieu van der Poel and Wout van Aert.
Discovering your muscle typology can also help with pacing strategy, says Lievens, as a slow typology might be best suited to even pacing, while a fast typology should start slow and finish fast.
That’s because athletes with a fast typology fatigue quicker, meaning their training volume and frequency should be lower than the slow group, too.
“Their recovery duration between intense sessions should also be longer,” says Lievens.
“As should their recovery duration between intense exercises within training sessions. And their taper longer.”
This is all well and good, but this machine’s currently stationed in Belgium. Back in Britain, you can find a university that offers muscle-biopsy analysis. Or you can go for the more parochial, albeit non-invasive and pretty accurate methods of physical tests.
These include a 60-second jump test, where you jump continuously for 60 seconds and see how your vertical distance tails off. A dramatic height and then drop-off suggests you’re a fast-twitcher; slow-twitchers are more of a plateau.
05: Platform for success
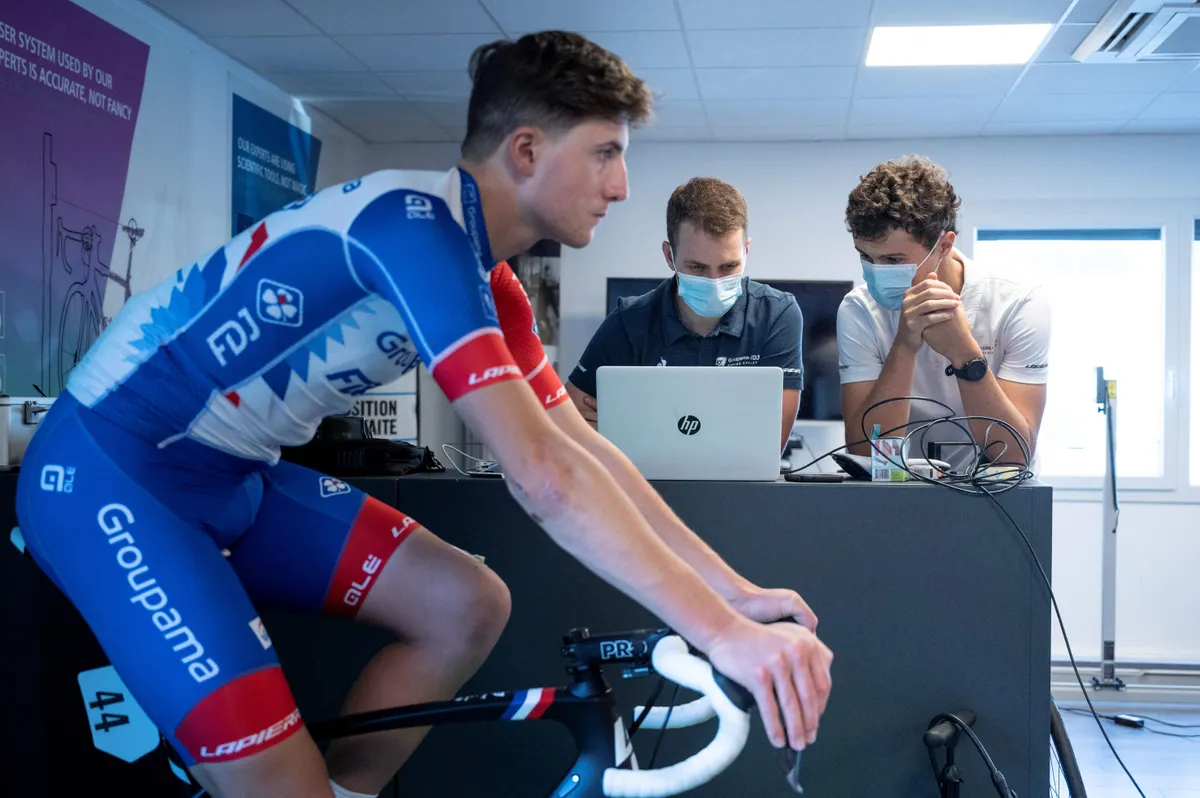
Victor Scholler holds a PhD in sport science and currently works with the French WorldTour team Groupama-FDJ. He also knows how to make a cyclist comfortable on the bike.
“Through our research, it’s clear that a dynamic bike fit is better than a static alternative,” says Scholler.
A dynamic bike fit is like those delivered by Retül. In general, they’ll involve a comprehensive physiotherapy assessment off the bike before analysing your riding technique on a jig via motion-capture technology. The data is then analysed by the practitioner. But, says Scholler, not all professional bike fits are equal.
“3D motion capture is superior to the 2D system, as it’s a more realistic interpretation of your pedal stroke. But arguably even more important than that is the quality of the person undertaking your bike fitting.”
Training and communication are key, so that you leave your fit sessions with things to work on when implementing any changes. Choose wisely, however, and it’s worth the outlay.
“Dynamic assessment is better than static because it takes into account your actual pedal stroke. Riders vary greatly in how much they flex their ankles.
"This alters your knee angle, which is the main focus when it comes to saddle height because you want your quadriceps to function at their optimal length to deliver power.
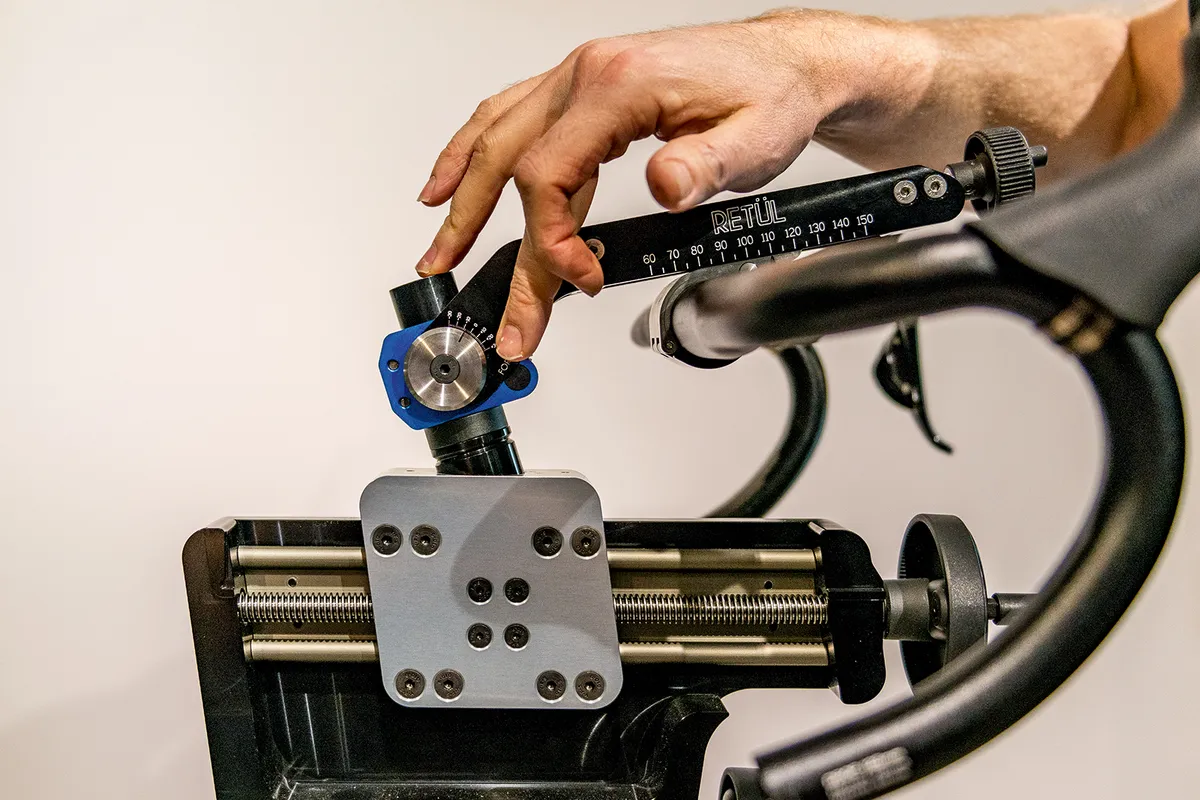
"A dynamic fit takes into account factors like hip rocking, too, plus leg differences.”
Scholler supports his advice with research, suggesting knee injuries in the professional ranks are down from 28 per cent to 6 per cent, “most likely due to the improvements in bike fitting”.
That said, Scholler suggests static fitting still has a place. “For a lot of people, especially if you’re new to cycling, it’s probably good enough.
"How you calculate yours is simply measuring your in-seam. Your saddle height should be around 106 to 109 per cent of this figure.”
To do this, stand barefoot against a wall with a thick book between your legs. Pull the book upwards so it feels almost uncomfortable.
Spin around and mark the top of the book on the wall. This is your in-seam. Now measure this distance to the floor, multiply by 1.06 and you have your saddle height, which you can play around with when out riding. It’s an old-school solution that still has its place in the modern world.
If you're interested in other techniques for determining the correct saddle height for you, check out our full in-depth guide.
This was the seventh edition of the Science & Cycling Conference, which was first held prior to the 2014 Tour de France in Leeds, Yorkshire.
It’s a meeting place for experts in the field of cycling to share their latest research and for companies to give demonstrations of their products. Dates for the 2022 edition have yet to be confirmed.

