Too rushed to read? We've updated this article with the latest edition of the BikeRadar Podcast. In this episode, Seb Stott talks through his findings with Matthew Loveridge, and offers his own perspective on how we convince people to switch to bikes. Otherwise, read on for Seb's original piece.
If you don't want to miss a new episode of the BikeRadar Podcast, click the buttons below to subscribe via Apple or Spotify. Or just search for us on your preferred podcast provider.
You can also head to the BikeRadar Podcast page to browse through our full archive of episodes.
Have you ever pedalled past a queue of idling cars and thought to yourself, 'wouldn’t it be better if more people cycled to work?' Well, how much better, exactly?
The UK is one of a growing number of countries to have pledged in law to get to net-zero carbon emissions by 2050.
But while progress has been made in some areas, emissions from transport continue to rise. We’re not going to get to net-zero without dramatic changes to how we move about. Could cycling be part of the solution?
To better understand the potential impact of cycling on a sustainable future, we set out to find out just how green cycling actually is. In the process, we’ve tried to answer two key questions:
- What is the carbon cost of cycling and how does it compare to other forms of transport?
- Could a dramatic increase in cycling for transport budge the needle on our collective carbon footprint?

To answer the first question, we’ll look at the emissions produced from bicycle manufacturing and the extra food/calories needed to cycle.
We’ll also investigate how traditional cycling compares to riding an electric bike, as well as walking, getting the bus and driving petrol and electric cars, in terms of the total carbon emissions per kilometre travelled.
In short, we find that while making bicycles and the food to power them carries a carbon cost, cycling is among the lowest carbon-per-kilometre modes of transport – it's even better than walking.
We estimate that if cycling’s popularity returned to 1940s levels (when the average Brit cycled six times further per year than today) and these trips replaced car journeys, that would create a net saving of 7.7-million tons of CO2 per year in the UK.
Key findings
- Cycling has a carbon footprint of about 21g of CO2 per kilometre. That’s less than walking or getting the bus and less than a tenth the emissions of driving
- About three-quarters of cycling’s greenhouse gas emissions occur when producing the extra food required to “fuel” cycling, while the rest comes from manufacturing the bicycle
- Electric bikes have an even lower carbon footprint than conventional bikes because fewer calories are burned per kilometre, despite the emissions from battery manufacturing and electricity use
- If cycling’s popularity in Britain increased six-fold (equivalent to returning to 1940s levels) and all this pedalling replaced driving, this could make a net reduction of 7.7-million tons of CO2 annually, equivalent to 6% of the UK’s transport emissions
The problem to be solved: transport emissions aren’t falling fast enough
In order to uphold the Paris agreement and keep global warming below two degrees Celsius above pre-industrial levels, the EU and UN is aiming to reduce its greenhouse gas (GHG) emissions by 80 to 90 per cent before 2050, while the UK has pledged to get to net-zero emissions by then.
Net-zero doesn't mean zero emissions, but rather minimising emissions while developing carbon-negative technologies such as direct-air capture, enhanced weathering, regenerative agriculture and afforestation to offset the rest. Reducing positive emissions to a minimum is essential, but this alone will not be enough.
There is some good news. According to Our World In Data, the UK’s domestic emissions (greenhouse gases emitted within the UK) fell by 36 per cent from a peak in 1991 to 2018 (the latest available data).
Even when taking account embodied emissions generated when producing imported goods, emissions fell by 24 per cent between the peak in 2007 and 2017.

This progress has been led by the electricity sector. Falling electricity demand, combined with swapping coal for natural gas, renewables and biomass (the role of biomass is not without controversy) has led to a 60 per cent drop in emissions from electricity generation.
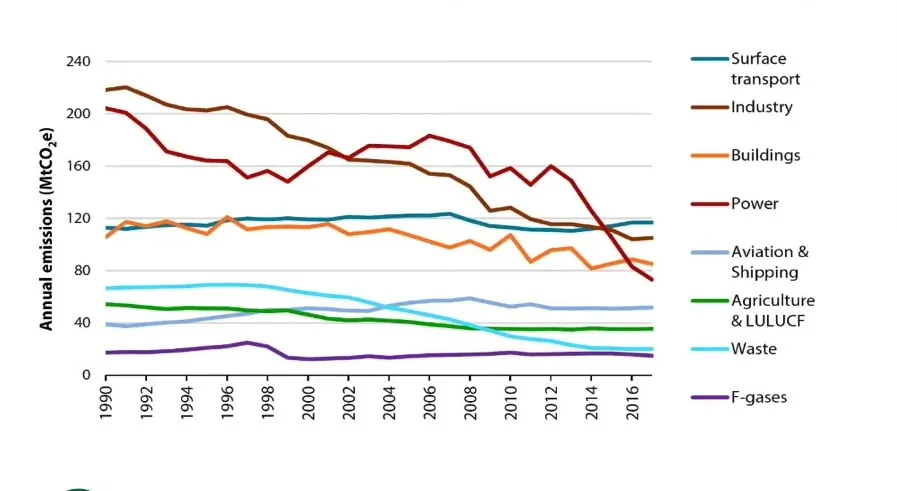
But to get to net-zero, emissions from all sectors must be slashed. Emissions from transport fell by just 2 per cent between 1990 and 2017. Surface transport alone (excluding aviation and shipping) now represents 27 per cent of the UK’s total domestic greenhouse gas emissions, compared to 24 per cent for electricity generation, making it the UK’s number one source of CO2.
This is not just a British problem. Transportation emissions in the EU rose by 36 per cent between 1990 and 2007, while those from other sectors fell.
To get to net-zero, we’ll need to rethink how we travel. Is cycling part of the solution?
Just how green is cycling as a mode of transport?
In order to compare the emissions from cycling to other forms of transport, we need to work out the total amount of greenhouse gases (GHG) released per kilometre travelled.
This requires a life cycle analysis. LCAs are used to compare emissions between all sorts of products, from power stations to PlayStations.
They work by adding up all the sources of emissions from the entire lifespan of a product (production, operation, maintenance and disposal) and dividing this by the amount of useful output the product can provide in its lifespan.
For a power station, that output may be the total amount of electricity it will generate in its lifespan; for a car or a bike, the number of kilometres travelled.
To calculate the per-kilometre emissions for cycling so they can be compared to other modes of transport, we need to know:
- The GHG emissions associated with the manufacturing and disposing of a bicycle. This can then be divided by the average number of kilometres it will travel between production and disposal.
- The emissions from producing the extra food required to ‘fuel’ the cyclist per kilometre. This is done by working out how many extra calories it takes to cycle each kilometre, and multiplying it by the average food production emissions per calorie of food produced.
It’s worth acknowledging that this method is simplistic for a few reasons.
First, it assumes that every extra calorie burned is another calorie consumed through diet. But according to this review paper titled “The Effects of Exercise on Food Intake and Body Fatness: a Summary of Published Studies”, when people burn more calories through exercise they don’t typically consume as many extra calories in their diet.
In other words, they lose weight through a calorie deficit. Therefore, this analysis may be an overestimate for cycling’s food-based emissions.
Second, it assumes that people don’t change the type of food they eat when they exercise, only the quantity. Different foods have very different environmental impacts.
Also, it doesn't take into account the possibility that if people cycle more they might take more showers or do more laundry, or have more money to spend on other polluting activities (environmentalists call this a rebound effect).
What is the environmental cost of manufacturing a bike?

Fortunately, this study, entitled “Quantifying CO2 savings of cycling”, conducted by the European Cyclists’ Federation (ECF), has done a lot of the legwork.
The authors drew on data from a standard database called Eco-Invent, which catalogues the environmental impact of supply chains for various materials and products.
From this, they calculate that manufacturing an average Dutch commuter bike, weighing 19.9kg and composed mostly of steel, causes the release of 96kg CO2e.
This figure includes manufacturing spare parts required throughout its lifespan. They argue that the emissions involved in the disposal or recycling of the bike are negligible.
CO2e (CO2 equivalent) means the total global warming potential of all greenhouse gasses emitted (including CO2, methane, N2O etc.) expressed as the mass of pure CO2 required to induce the same amount of warming over a 100-year timespan.
Materials matter
According to the World Steel Association, there is an average of 1.9kg of CO2e emitted per kg of steel produced.
Whereas according to the European Aluminium Environmental Profile Report, an average of 18kg of CO2e is released per kg of aluminium produced, but recycled aluminium has just 5 per cent the carbon cost of virgin material.
Clearly, manufacturing emissions vary greatly by material, and so manufacturing emissions will vary by bike.
Muddying the waters further, this report from Duke University estimates that manufacturing an aluminium Specialized Allez road frame alone produces 250kg CO2e, while making a carbon-fibre Specialized Roubaix frame produces 67kg.
The authors suggest that the heat treatment of high-end aluminium frames adds considerably to manufacturing energy demand and carbon footprint. However, the authors note there may be considerable inaccuracies in the study. We have asked the study’s authors and representatives from Specialized to elaborate on this, but haven't yet received a response.
Because these numbers may not be accurate or typical of the bike industry as a whole, we'll use the ECF's estimate of 96kg CO2e per bike produced, but be aware that the carbon footprint of an individual bike will likely vary greatly.
Of course, greenhouse gases are not the only issue with manufacturing a bike. There's also water pollution, particulate air pollution, landfill-waste, etc, which create other issues besides contributing to climate change. This article is focused purely on the global warming impact of cycling.
Manufacturing emissions per kilometre
The ECF further estimates that an average bike has a lifespan of 19,200km.
So, if the 96kg of CO2e required to make a bike is spread among 19,200 kilometres that works out to 5g of CO2e per km of cycling from manufacturing emissions.
What is the carbon cost of producing the food required to cycle a kilometre?
The ECF calculates that an average cyclist travelling at 16km/h and weighing 70kg will burn 280 calories per hour, compared to 105 calories per hour if they weren’t cycling. So an average cyclist consumes 175 extra calories per 16km; that works out at 11 calories per kilometre.
To convert this into emissions per kilometre, we also need to know the average GHG emissions per calorie of food produced. Food production emissions come in many forms, including land-use changes (such as flooding fields and deforestation), fertiliser production, livestock emissions, transportation and refrigeration. It's worth pointing out that transportation (food-miles) is only a small fraction of total food-systems emissions.
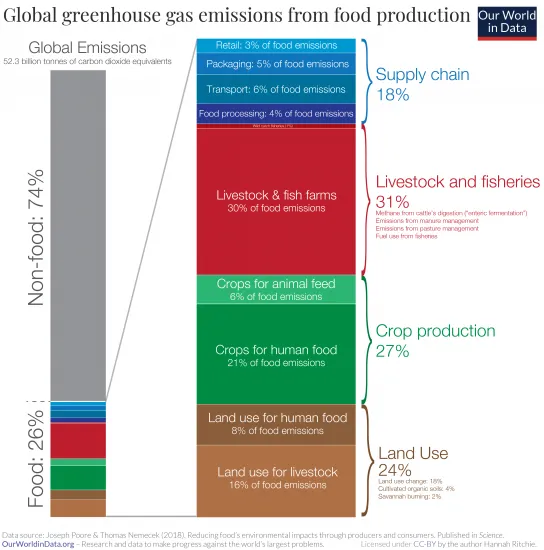
The ECF estimates that the average European diet is responsible for 1.44g CO2e per calorie of food consumed.
It’s unclear how it arrived at this figure, but we used data from Our World in Data and a rough calculation to check, and came to a similar estimate for the global average by dividing the global annual food production emissions by the number of calories consumed (globally) in the same year.
Multiplying 1.44g CO2e per calorie by 11 calories per kilometre corresponds to 16g CO2e per kilometre of cycling from food production emissions.
Diet matters

This is an estimate based on average CO2e emissions per calorie, but the type of food eaten makes a big difference. According to this paper published in the reputable journal Science, beef contributes on average 52g CO2e per calorie; this corresponds to 570g CO2e per/km if all the calories required to pedal came from beef.
That would make cycling more environmentally damaging than driving.
On the other hand, the paper found that wheat, rye, potatoes and maize (corn) all produce under 1g of CO2e per calorie produced. So if the extra calories came from these carbohydrates (best case scenario), the GHG emissions per kilometre could be lower than we’ve estimated.
What are the total emissions for cycling one kilometre?
Adding the 16g per kilometre for food production to 5g per kilometre for bike manufacturing gives a total of 21g CO2e for cycling each kilometre.
By this estimate, more than three-quarters of cycling’s carbon emissions come from food production.
How do the emissions from conventional bikes compare to electric bikes?

Electric bike manufacturing
The ECF estimates that ebikes have a higher average manufacturing carbon footprint than conventional bikes, at 134kg CO2e compared to 96kg.
Here’s a quick reality check on this figure. According to the Union of Concerned Scientists, lithium-ion batteries used in cars release about 68kg CO2e per kWh of battery capacity produced.
Ebikes typically use 0.5kWh battery packs, so we can estimate emissions of 34kg CO2e for making the battery. This tallies with the ECF’s estimate of the additional emissions from ebike manufacturing.
Assuming the same 19,200km lifespan we used for the conventional bicycle, this equates to 7g CO2e per km for the ebike, compared to 5g for the normal bike.
Electric bike electricity consumption
The ECF also estimates that an ebike uses 23Wh (Watt-hours) of electricity per kilometre travelled, and multiplies this figure by the average amount of CO2e produced per Wh of electricity in Europe in 2006 (0.383 g CO2e per/Wh). This led to an estimate of 9g of CO2e per km.
However, at that rate of consumption, a 500Wh ebike battery would provide a range of just 22km. Our experience of testing ebikes on the road suggests this is a very low estimate.
According to Bosch’s ebike range calculator, a city ebike with a 500Wh battery will provide a range of 94km under typical commuting conditions (assuming 22km/h average speed, mountain bike tyres, “sports” assistance mode and 85kg combined weight). This is more in line with what we have found when testing and reviewing electric road bikes.

While Bosch may be accused of being optimistic when estimating its own product’s range, BikeRadar’s senior technical editor Warren Rossiter has found that e-road bikes with a battery half that size (250Wh) can deliver an average range of about 80km – albeit with skinny tyres.
Travelling 94km on 500Wh works out to 5.3Wh per km. Assuming a charging efficiency of 90 per cent (not all the energy from the plug makes it into the battery), an ebike will require 5.9Wh of electricity from the grid to travel each kilometre.
Furthermore, according to UK government figures, the carbon intensity of electricity in the UK in 2019 was far lower than it was in the EU in 2006, at 0.256g of CO2e per Wh of electricity.
Combining these figures (5.9Wh per km and 0.256g per Wh) gives a more up-to-date and UK-centric estimate of 1.5g CO2e per/km from electricity use.
Electric bike food consumption
The ECF assumes an average 70kg cyclist on an ebike will burn only 4.4 extra calories per kilometre over and above the amount used when not exercising (compared to 11 for the conventional bike). Using again the ECF’s estimate for food production emissions (1.44g CO2e per calorie), we get 6.3g CO2e per/km from food production.
Bikes vs ebikes: which is more eco-friendly?
Adding all this up, we arrive at 14.8g CO2e per kilometre travelled by ebike.
That’s 30 per cent lower than the figure from cycling a conventional bike.
Because ebikes require less food production per kilometre travelled, they have lower greenhouse gas emissions over their lifetime than conventional bikes, despite the added emissions from electricity production and battery manufacturing.
| | Conventional bicycle | Electric bicycle |
|---|---|---|
| Manufacturing emissions (g/km) | 5 | 7 |
| Food-related emissions (g/km) | 16 | 6.3 |
| Electricity emissions (g/km) | 0 | 1.5 |
| Total (g/km) | 21 | 14.8 |
How does walking compare?

To calculate the greenhouse gas emissions from walking we only need to look at the additional food requirement per kilometre.
An average 70kg person walking at 5.6km/h (3.5mph) on level ground will burn approximately 322 calories per hour, compared to 105 calories per hour if doing no exercise. That’s 217 extra calories per hour (or per 5.6 kilometres travelled) or 39 calories per kilometre.
Using the same estimate for European food production emissions as for cycling (1.44g CO2e per calorie) and multiplying this by 39 calories per kilometre gives us 56g CO2e per kilometre from walking, just to provide the extra food.
This suggests that walking each kilometre results in 2.7 times the emissions of cycling or 3.8 times that of riding an ebike, due to walking’s higher calorific demand per kilometre.
As mentioned before, this analysis assumes that every calorie burned corresponds to an extra calorie consumed, which is not always the case.
How does travelling by car compare?
To estimate the potential for cycling to save carbon emissions, we need to see how cycling’s per-kilometre emissions compare to driving.
Manufacturing
According to ADME (the French environment and energy management agency), the average European car produces 6.6 tons of CO2e during manufacture, and will travel 157,000km in its lifetime.
That works out to 42g CO2e per kilometre from production emissions alone.
Fuel
According to the Department for Transport, greenhouse gas emissions from the tailpipe of cars in the UK totalled 70-million tons of CO2e in 2016, and there were 410-billion vehicle-kilometres driven by cars in that year. This works out to an average of 171g of CO2 per kilometre from tailpipe emissions.
But it’s not that simple.
First, there are emissions involved in extracting, transporting and refining crude oil into petrol and diesel, known as well-to-tank emissions.
According to the European Environment Agency (EEA), for every 100g of CO2 released through burning fuel in cars (tailpipe emissions), a further 17g is emitted during the production of that fuel (well-to-tank emissions).
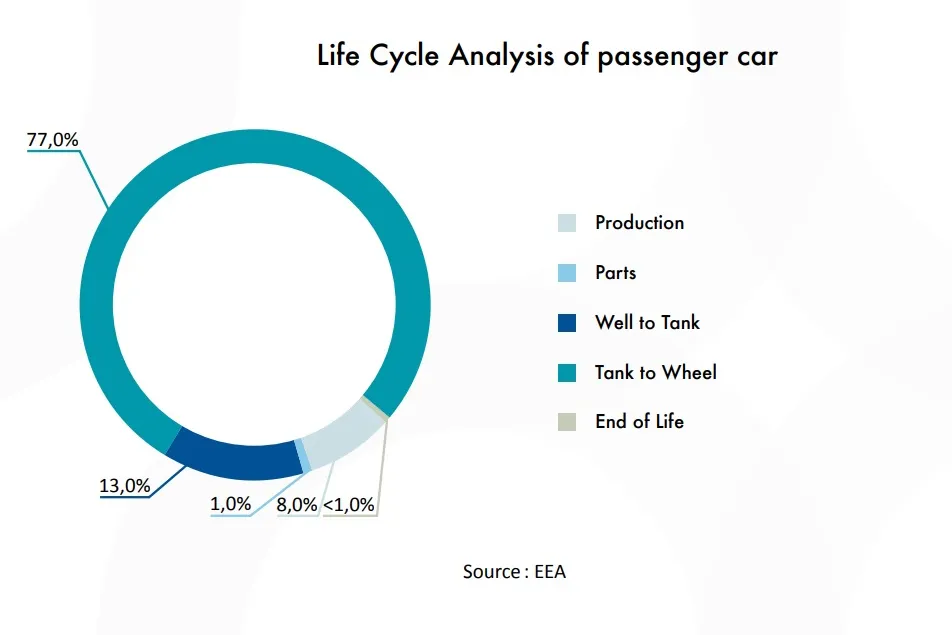
These well-to-tank emissions are usually counted under the industrial (rather than transport) sector, but for our purposes we need to include both.
That takes our estimate of the average UK car emissions from 171g to 200g CO2e per km.
It gets worse. We want to compare the emissions from cycling with driving the equivalent journey. Internal combustion cars are considerably less economical over short trips, due to idling, cold starts, stop-starting etc.

The ECF estimates that for short journeys that compete with cycling, the average European car emits 266g CO2e per kilometre of driving, including both tailpipe and well-to-tank emissions.
This figure is still not ready to be compared to cycling because cars can carry multiple people. The ECF estimates that for such short trips, the average car has an occupancy of 1.16 passengers. That works out at 229g CO2e per passenger-kilometre from fuel use and fuel manufacturing.
Total Co2 emissions for cars compared to bikes
Adding this to the manufacturing emissions (42g/km) gives a total of 271g CO2e per passenger-km of driving. That’s around 13 times the emissions from cycling.
What about electric cars?
In order to assess the environmental impact of any future policy or technology, it’s no good just comparing it to the current alternatives – we also have to compare it to the future alternatives.
Electric cars are often touted as the future of cleaner personal transport, but how do their total emissions compare to internal combustion cars and to bicycles?
This paper published by the Union of Concerned Scientists (UCS) looks at current electric vehicles in the US and compares them to internal combustion cars in a life cycle analysis.
The authors estimate a typical mid-size electric car produces 128g CO2e per kilometre over its lifespan. That’s assuming a 217,000km lifespan and electricity generation mix which is typical for current EV (electric vehicle) users in the US.
However, this figure is not directly comparable to the above estimate for internal combustion cars in the EU because the Union of Concerned Scientists assumes a longer lifespan than the ECF and the electricity generated in the US is more carbon-intensive than it is in the EU or in the UK.
Let’s adapt that estimate to make it more comparable for the UK.
According to the UCS, manufacturing a mid-size electric car results in 7.7 tons of CO2e (about 15 per cent more than the equivalent average-sized petrol car). If we assume the car is driven for 157,000km, as we did for the internal combustion car above, that corresponds to 49g CO2e per kilometre from manufacturing emissions.
This may be an overestimate as it assumes the battery cannot be re-used or recycled after the car has driven this distance, and so more batteries have to be made again from scratch. This is the worst-case scenario. The UCS also predicts that manufacturing emissions for batteries will decrease as technology improves.
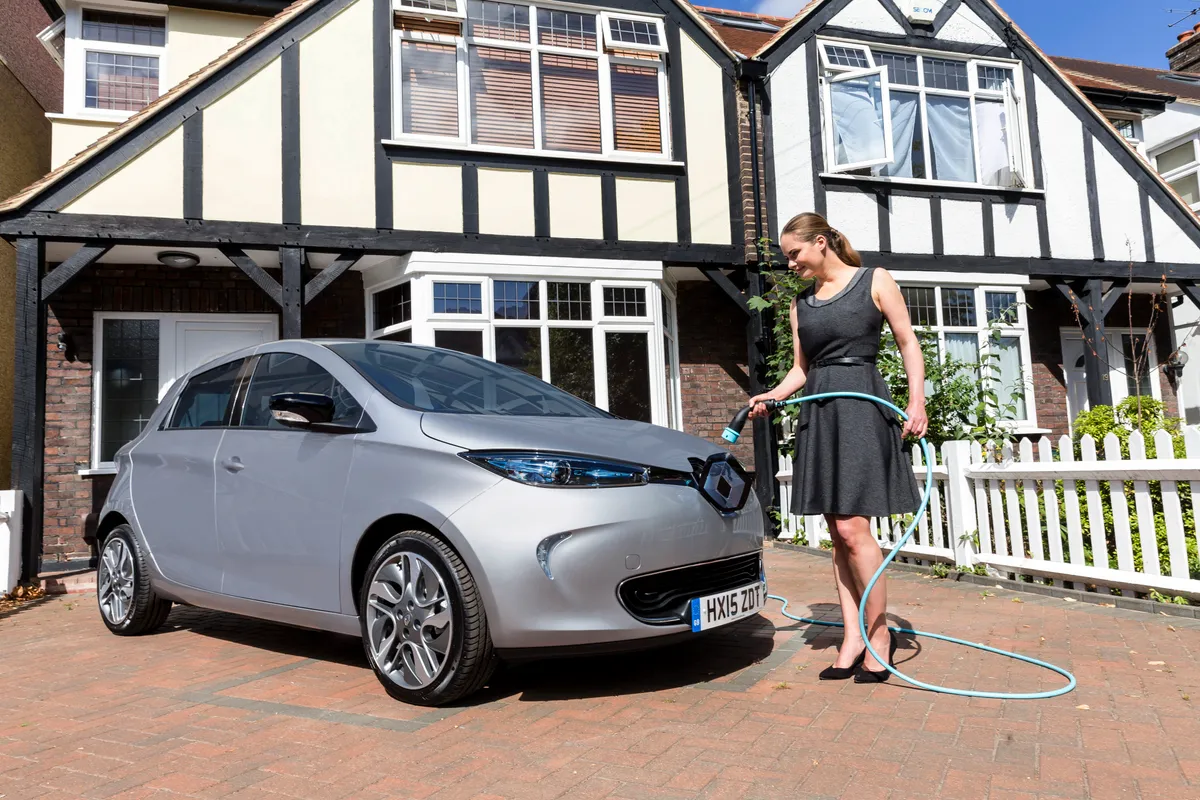
According to the UCS, a mid-size EV uses about 0.19 kWh of electricity per kilometre driven. Unlike with internal combustion cars, electric vehicles are more efficient around town than on the highway, so this is perhaps a high estimate when looking at short journeys that compete with cycling.
In the UK in 2019, the average amount of CO2e produced in electricity production was 0.2556 kg CO2e per kWh, according to the UK government. Multiplying this by the UCS estimate for electric vehicle consumption per kilometre, this corresponds to 48g CO2e per km from electricity use. This figure will come down if the electricity grid continues to decarbonise.
As with internal combustion cars, we’ll assume electric vehicles average 1.16 passengers for journeys comparable to cycling. This brings the electricity emissions down to 41g per passenger-kilometre.
The above assumes the extra electricity required to power electric cars has the same carbon intensity as current average electricity, which is a little simplistic.
Because EVs increase the overall demand for electricity, they will affect how it’s generated. On one hand, EVs can be charged at night, or whenever electricity is cheapest or greenest, so the carbon footprint of electricity used by EVs may be lower than average.
This charging flexibility, and the potential for EVs to discharge to the grid when demand is highest, suggests that mass EV adoption could accelerate the uptake of intermittent energy sources like wind and solar.
On the other hand, the extra electricity demand could slow efforts to decommission coal and gas power plants. The point is, the long-term environmental impact of EVs will depend greatly on how they influence future electricity generation.
Total emissions for electric vehicles
Adding the emissions from manufacturing and electricity production together, we get 90g CO2e per passenger-kilometre.
So electric cars pollute much less per kilometre than internal combustion cars. Over short journeys that compete with cycling, and when using relatively clean UK electricity, they produce around a third of the the CO2 per kilometre of an internal combustion car, but over four times more than bicycles.
What about buses?
The ECF estimates GHG emissions for travelling by bus in much the same way as the internal combustion car.
It assumes that buses, like internal combustion cars, have manufacturing emissions of 5.5 tons of CO2e per ton of vehicle. Other assumptions include an average vehicle weight of 11 tons, that buses are driven for one million miles before disposal, and that they carry an average of ten passengers.
With these assumptions, the ECF estimates that travelling by bus produces 101 g CO2e per passenger-kilometre.
Of course, this figure varies greatly depending on the occupancy of the bus. This MIT study estimates that the operation and manufacturing emissions for a typical US bus add up to 49g CO2e per passenger-kilometre at peak times and 393g at off-peak times when the bus is less busy.
As with passenger cars, electrifying buses could make for dramatic reductions to their carbon footprint, but we were unable to find data on the carbon footprint of electric buses.
What we’ve learned so far: how do transport emissions compare?
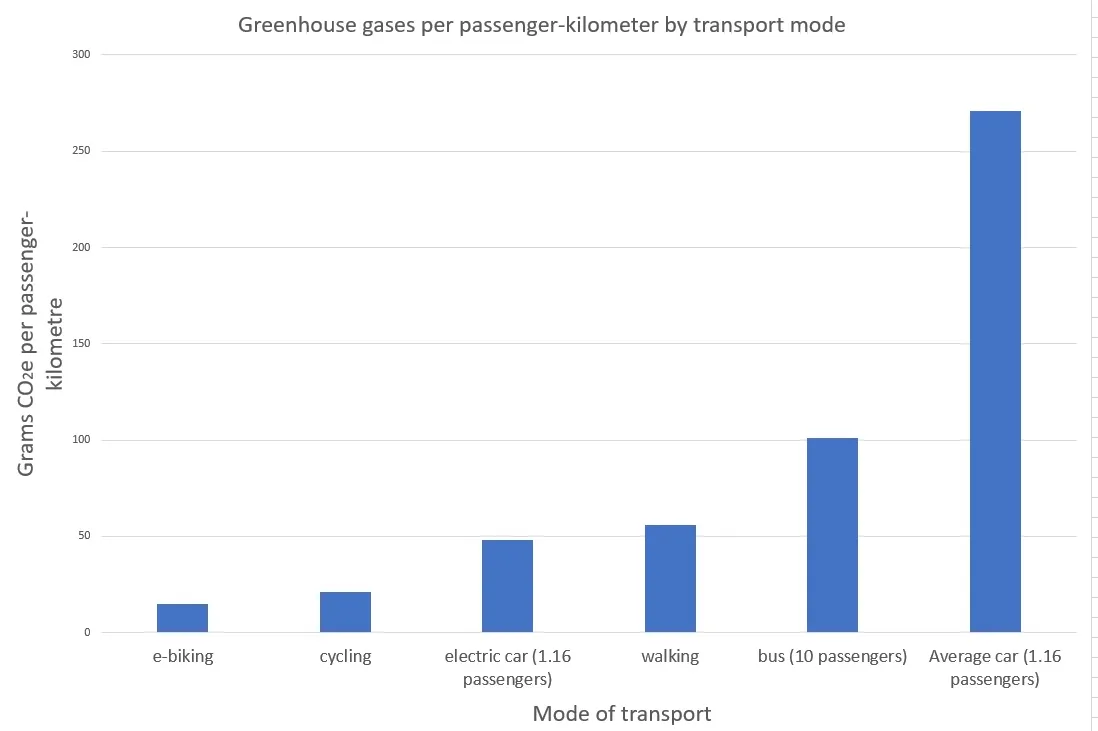
Ebiking and cycling are clear winners in terms of CO2 emissions per kilometre, even when compared to walking, electric cars and getting the bus. Over short distances, driving an average petrol or diesel car emits more than ten times the CO2 per kilometre compared to cycling.
So cycling is greener, but how big an impact could it make?
According to the Department For Transport, 5.3-billion kilometres were cycled in the UK in 2018 for all purposes. With a population of 66-million that works out as a paltry 80km per person per year on average.
Surprisingly, back in 1949 Brits cycled 474 kilometres per person per year, while the Danes currently manage 936km per person per year. If modern Brits cycled as much per person as they did in the forties (still only half what the Danes do), it would equate to 31-billion kilometres per year in total.
Brits drive a total of 61 5-billion kilometres per year on journeys of less than five miles, according to the Department for Transport, so increasing cycling to 1940s levels would be the equivalent of replacing half of these short trips.
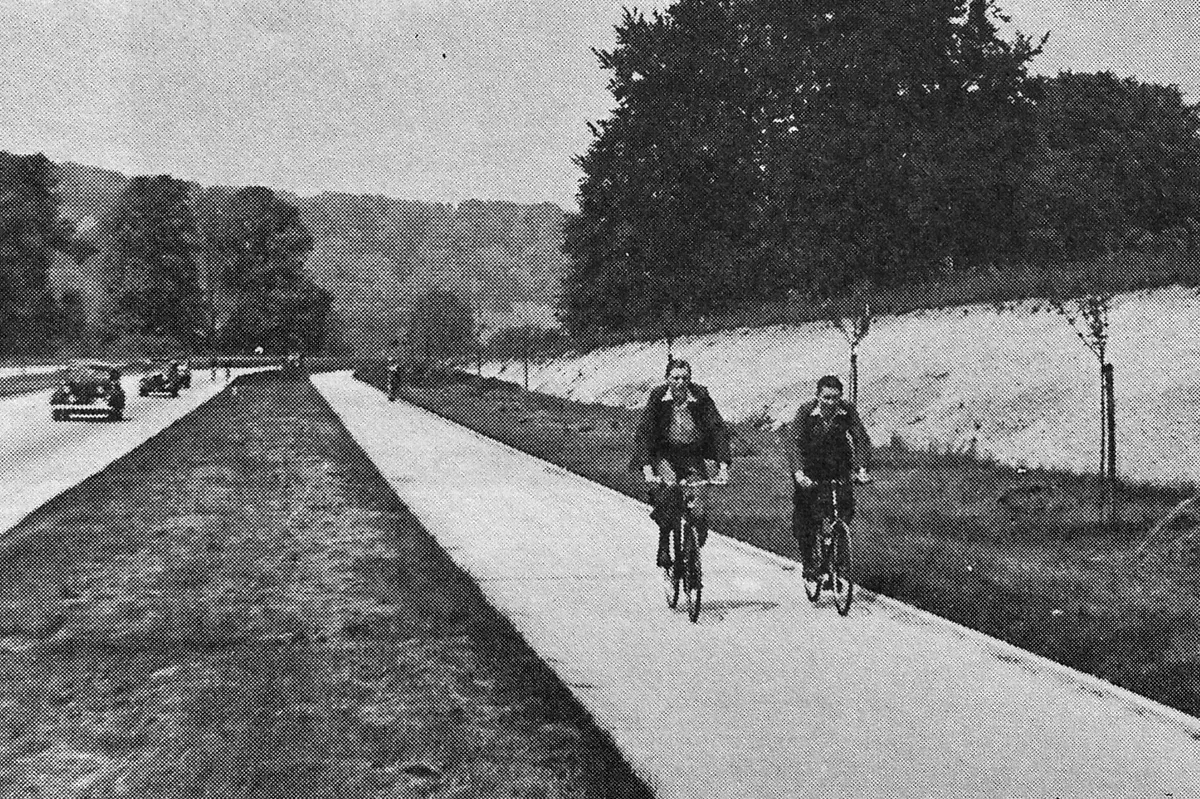
In a best-case scenario where cycling in Britain returned to peak 1940s levels, and all this extra cycling replaced driving, how much of an impact could this have?
We worked out earlier that conventional bikes generate about 21g CO2e per/km, so cycling 31-billion kilometres would produce 0.7-million tons of CO2e through additional bike and food production.
But the corresponding reduction in car journeys would lead to a reduction of 8.4-million tons of CO2, so there would be a net reduction of 7.7-million tons of CO2 annually.
Even in a future where all cars are electric (but still using current electricity), replacing 31-billion kilometres of driving with cycling would result in a net saving of 2.1-million tons of CO2 every year.
Is this a big number?
7.7-million tons of CO2 is roughly equivalent to 13-million flights from London to New York every year.
According to gov.uk, total transport emissions in the UK in 2016 equated to 126-million tons of CO2e (this includes all surface transport plus domestic flights and shipping, but excludes the emissions required to manufacture fuel and vehicles), which accounted for 27 per cent of all UK domestic emissions.
So, that 7.7-million-ton saving is equivalent to 6 per cent of the UK’s current transport emissions, or 2 per cent of its total current domestic emissions.
How does cycling compare to other ways of reducing transport emissions?
One of the most popular ideas for reducing transport emissions is simply swapping petrol and diesel for electric cars. This is not just a hypothetical idea – the UK government has pledged that all new cars will be zero-emission (electric or hydrogen-powered) by 2035.
According to the Department for Transport, 410-billion vehicle-kilometres were driven by car or taxi in the UK in 2016.
Based on the calculations above, but looking at emissions per vehicle-kilometre (as opposed to per passenger-kilometre), and for all journeys as opposed to short journeys, we can estimate that electric cars produce 97g CO2e per vehicle-kilometre, while current internal combustion cars produce 242g.
Converting all current car journeys to electric would save about 60-million tons of CO2 annually. That’s equivalent to 48 per cent of the UK’s current transport emissions, or 11 per cent of the UK’s total domestic GHG emissions in 2016.
That’s nearly eight-times more of an impact than our ambitious best-case cycling scenario. Not because electric cars are greener than bikes, but because people drive far further than they cycle (even in Denmark).
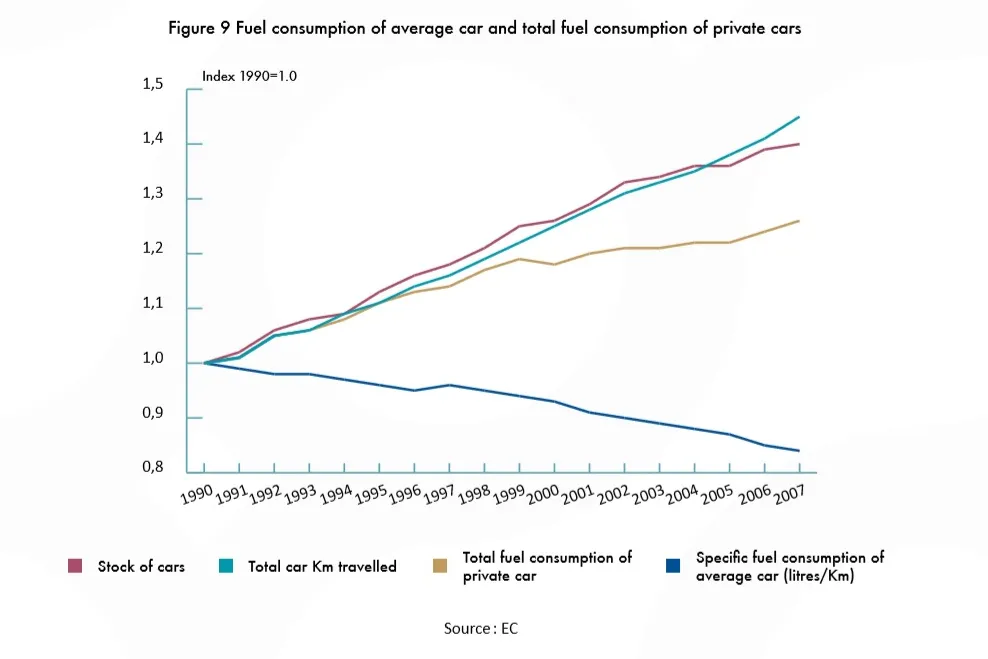
This crude calculation ignores any rebound effect, where greater efficiency leads to lower costs and therefore more driving, and more money to spend on other polluting activities, such as flying.
The rebound effect has contributed to a 40 per cent increase in driving in Europe since 1990, which has more than offset the improved efficiency of cars over the same period.
What’s the bottom line?
By these calculations, cycling has the lowest carbon footprint of any mode of personal transport, even when compared to walking.
From a climate perspective, it makes sense for as many journeys as possible to be made by bike.
On an individual level, cycling instead of driving (or any other method of travelling) can make a positive impact on your carbon footprint.
But on a national scale, cycling has a limited role in addressing climate change. Because cycling is restricted to short journeys for most people, it can only replace a small fraction of the kilometres covered by cars.
Even if half of all sub-5-mile car journeys were replaced with cycling (a deliberately optimistic scenario) this would save around 7.7-million tons CO2e in the UK, equivalent to 2 per cent of UK domestic emissions in 2016. Not to be sniffed at, but not a silver bullet.
Ebikes could boost the uptake of cycling to some extent.
It’s no coincidence that countries with the highest cycling rates are flat (Denmark and the Netherlands), and ebikes go a long way towards flattening the landscape from the cyclist’s perspective.
Because they’re faster and easier to ride, particularly when carrying cargo, they could help more people to cycle more journeys. Better still, by our estimates, they have an even lower carbon cost than conventional bikes because their riders require less extra food per kilometre travelled.

Currently, cars account for two-thirds of UK transport emissions, and car-reliance continues to rise. Reducing car-related emissions directly by swapping to electric will have a bigger impact than cycling in terms of cutting carbon emissions.
But even when compared to electric cars, we estimate travelling by bike has about one-quarter the carbon footprint per kilometre travelled, so cycling is still, journey-for-journey, the best option for the climate.
Replacing car journeys with cycling is also something many of us can do tomorrow, whereas electrifying the UK's vehicle fleet will take decades.
Beyond greenhouse gasses
While cycling is among the greenest ways to travel, this is just one of many reasons to ride a bike. This article focuses on climate change, but replacing cars with bikes would have many other benefits.
Sustrans, the UK's sustainable transport charity, outlines a few of them in its 2019 manifesto. These include cutting congestion, addressing health problems associated with sedentary lifestyles, thereby cutting sick days, increasing life expectancy and benefiting the economy, while cutting particulate air pollution – a problem which shortens global life expectancy by an average of 1.8 years according to one study, and has also been linked to an increased COVID-19 death rate.
While electric vehicles will reduce urban air pollution and CO2 emissions dramatically compared to current cars, they cause considerably more pollution than cycling, and won’t solve congestion or the problems associated with sedentary lifestyles.
In fact, they may add to them thanks to electric vehicles' lower running costs leading to more people driving.
Finally, let's not forget that cycling is meant to be fun! Most people ride a bike because it's cheap, convenient, healthy and enjoyable, not just because it's green.

